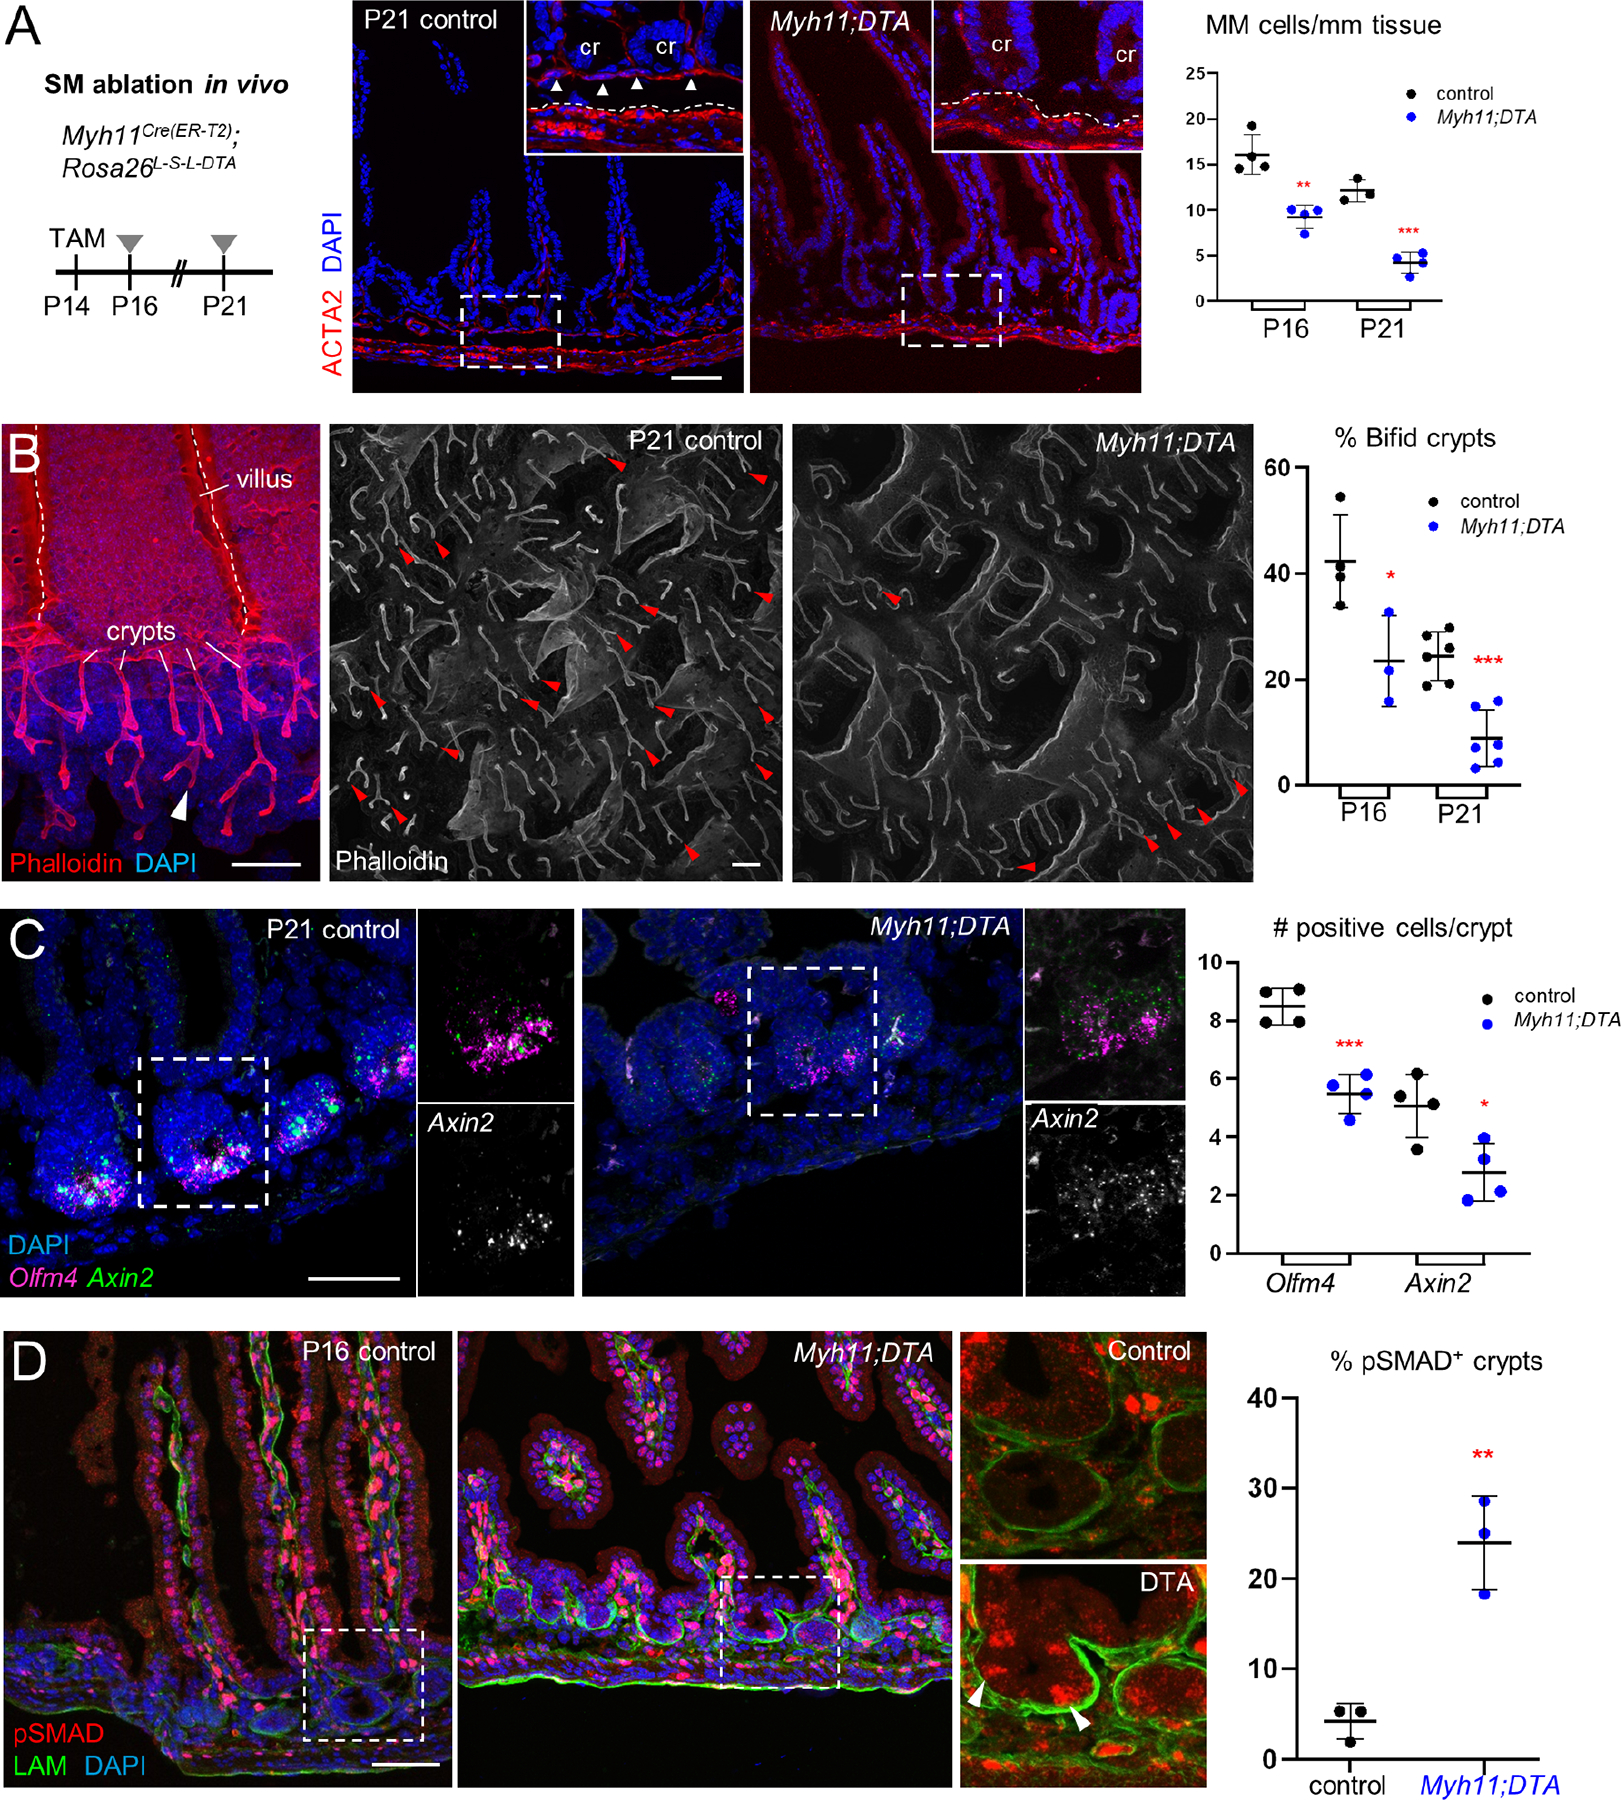
Figure 6. BMP-associated crypt attrition in mice with intestinal SM deficiency.

A) Intestines harvested at P16 and P21 from Myh11Cre(ER-T2);R26RDTA mice treated with TAM at P14 show reduced ACTA2-stained MM. Representative images at P21 are shown and boxed areas are magnified in the insets, where arrowheads point to the MM in the control (Cre− DTA+) specimen and dashed white lines mark the superficial MP border; cr: crypts. Scale bar 50 μm. Right: MM cells quantified from >4 mm tissue in each of 3 or 4 independent animals. Statistical significance was determined using unpaired Student’s t-test. **p <0.01, ***p <0.001.
B) F-actin (phalloidin)- stained epithelial whole-mount images showing considerably fewer bifid crypts (arrowheads) in Myh11Cre(ER-T2);R26RDTA compared to control pups treated with TAM at P14 and examined at P16 (Figure S7A) and P21. Right: Bifid crypts quantified from >100 crypts in each of 3–6 mice from each age. Statistical significance was determined using unpaired Student’s t-test. *p <0.05, ***p <0.001.
C) Crypt base cells expressing RNA for ISC markers Olfm4 (RNAscope ISH signal in magenta) and Axin2 (green) are decreased in TAM-treated Myh11;DTA animals at P21. n=4 mice per condition, >40 crypts per sample, statistics by unpaired Student’s t-test. *p <0.05, ***p <0.001.
D) Increased pSMAD1/5/9 immunostaining (arrowheads in bottom right image) in TAM-treated Myh11Cre(ER-T2);R26RDTA crypts, which lack pSMAD1/5/9 in controls (see also Figure 1A). Boxed areas are magnified in the two right images. pSMAD+ crypts were quantified in >80 crypts from 3 mice for each condition; statistical significance was determined using unpaired Student’s t-test. **p <0.01.
See also Figure S7.
