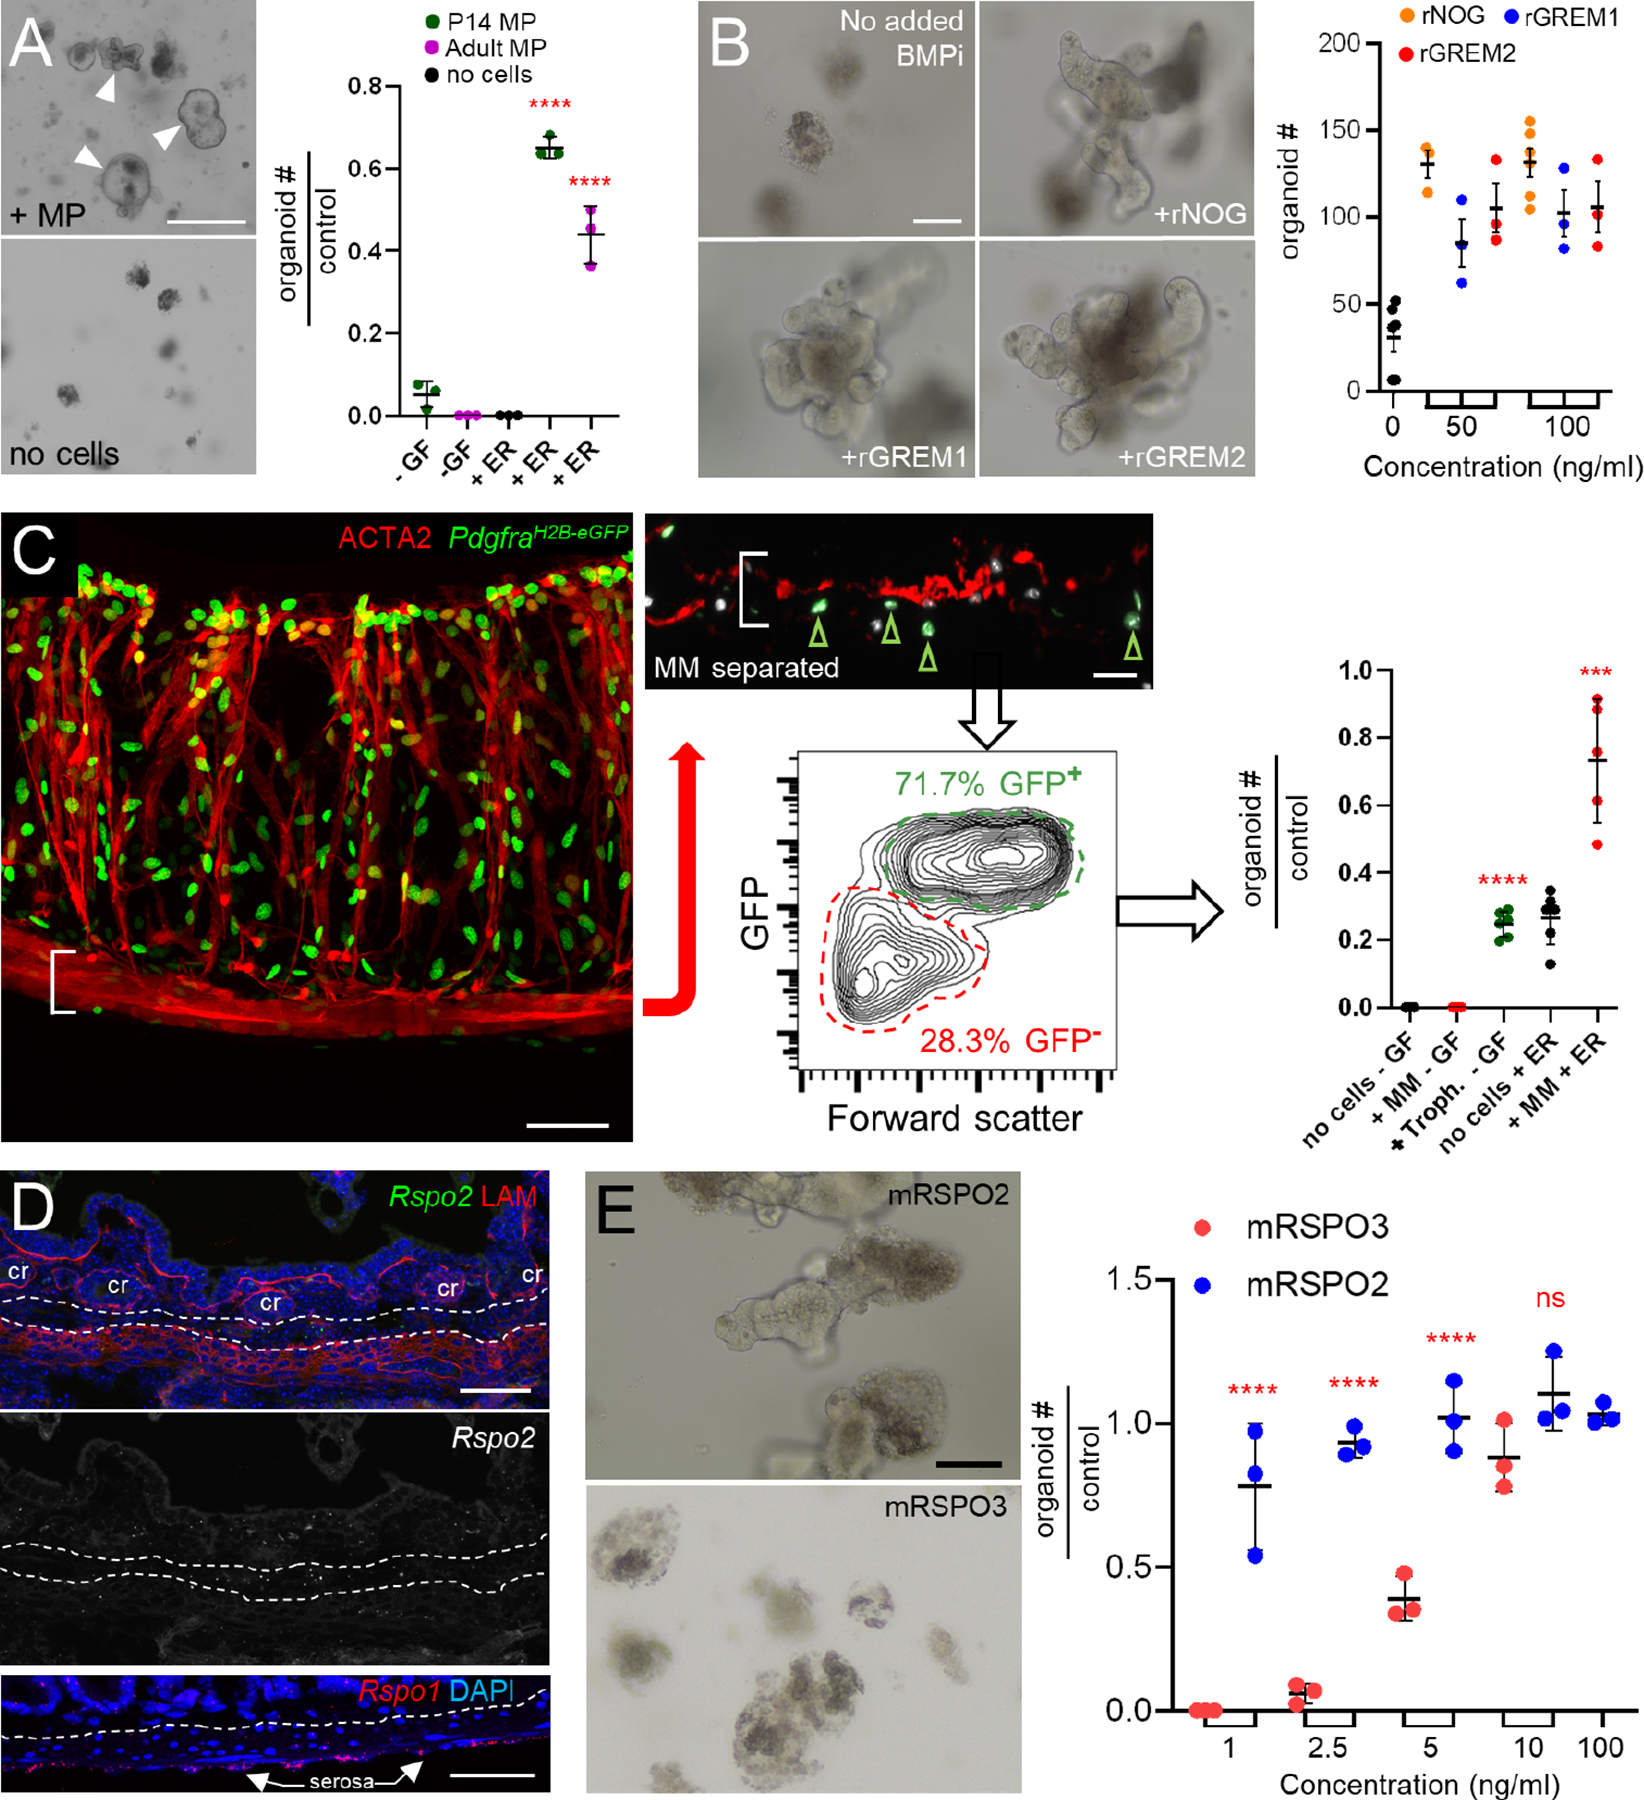
Figure 7. Adult MM and MP complement trophocyte activity in vitro by substituting for BMPi.

A) Adult SI crypts did not generate organoids when co-cultured with unfractionated P14 or adult MP (arrowheads) alone but did so when sub-optimal concentrations of rEGF and rRSPO were added to the co-cultures. In the graph, organoids are represented relative to the numbers generated in ENR medium (no added cells, 66 ±10.4 organoids, n=3). Significance determined by Student’s t-test, ****p <0.0001. -GF, no recombinant trophic factors.
B) Organoids arising from SI crypts after 5 days of culture in a sub-optimal concentration of rRSPO1 (see Methods) and 50 ng/mL or 100 ng/mL of rNOG, rGREM1, and rGREM2, which are roughly equipotent in this assay. n=3 biological replicates. One-way ANOVA with Dunnett’s test shows significance of all conditions to at least p<0.01 compared to control cultures with no added BMPi.
C) After MP removal, MM stripped from PdgfraH2B-eGFP colon retained GFP+ trophocytes on the undersurface (green arrowheads in inset) and flow cytometry separated GFP+ trophocytes from GFP− MM (see Figure S7G–H). Scale bars 50 μm. Right: In adult SI crypt co-cultures, the GFP+ trophocytes supported organoid growth without added factors, while GFP− MM provided support only in the presence of rEGF and rRSPO1 (ER medium). Significance assessed with respect to ENR-only controls (no cells, 31.7 ±5.5 organoids/well, n=5) using Student’s t-test. ***p <0.001, ****p <0.0001.
D) Top: Rspo2 ISH (green) and LAMININ immunostaining (red) in adult SI. Dashed lines demarcate the MM above and MP below. Trophocytes lie between these layers and express Rspo2; a greyscale version of the Rspo2 signal is shown below the color image without LAM; cr: crypts. Bottom: Rspo1 (red) ISH confirms high expression in the serosa as indicated by scRNA-seq (see Figure 3F). Dashed line: superficial MP, scale bars 50 μm.
E) Crypts cultured with as little as 1 ng/mL recombinant murine (m) RSPO2 form organoids with an efficiency that requires at least 10 ng/mL mRSPO3. Scale bar 50 μm. Graph depicts organoid-forming efficiency at 5 days relative to 100 ng/ml rRSPO3 (107.3 ±19.6 organoids/well, n=3). Statistical comparisons by one-way ANOVA followed by Tukey’s posttest, ****P <0.0001.
See also Figure S7.
