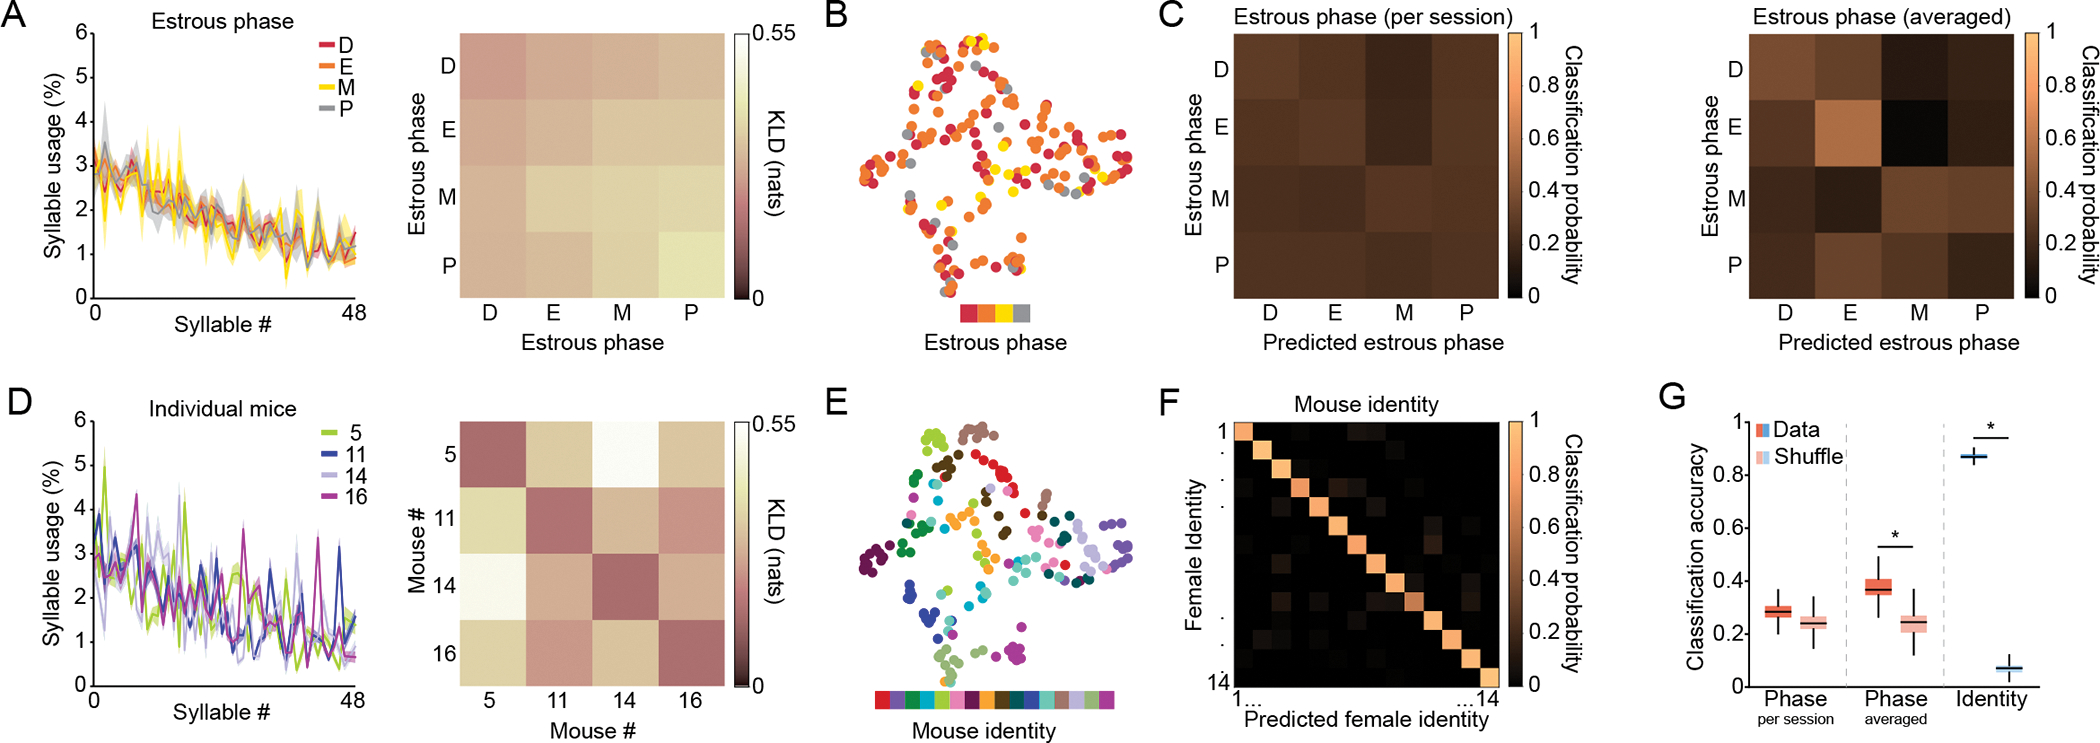
Figure 2: Female spontaneous behavior reflects individual variation rather than estrous phase.

A) Left: syllable usage distribution for each of the estrous phases averaged across four representative mice (presented also in panel D). Mean ± standard error of the mean (shaded area) is presented. MoSeq assigns each syllable a unique identifier (Syllable #) based upon how often that syllable was used across all the data subject to modeling (in this case across all female mice and sessions in our dataset), such that Syllable “0” is the most often used and subsequent syllables are less used; we maintain this syllable ordering across all syllable usage plots herein, but vary how the data are aggregated (for example, by estrous phase or individual identity). See Figures S2D for a similar analysis across all mice. Right: Kullback-Leibler divergence (KLD) values of pairwise comparisons between phase-related data presented in left panel. Here we compute a phase-dependent KLD by pooling all the sessions corresponding to a particular phase across mice, calculating the pairwise KLD between all sessions corresponding to the same or a different phase (as labeled), and then plotting the average value of those pairwise comparisons in each cell. These values quantify how similar syllable usage distributions are across the different estrous phases, with lower values indicating greater similarity. It is important to note that because phase-based comparisons incorporate data from different animals, if different individual mice exhibit distinct patterns of behavior those differences will be incorporated into this metric. B) Uniform Manifold Approximation and Projection (UMAP) plot depicting syllable usage in females for each session color coded by estrous phase. To assess cluster quality, K-means clustering analysis was performed on high-dimensional data, and clustering quality was quantified using the Adjusted Rand Index (ARI), where higher values indicate a greater match between clustering and data labels; for phase (number of clusters = 4) ARI = 0.03. C) Confusion matrix for classification accuracy of a decoder trained to predict estrous phase based on syllable usages. Decoder was trained on data from individual sessions, left; or averaged data per phase per mouse, right (see Methods). D) Left: same data as in A, but syllable use is now averaged across all sessions corresponding to the four representative mice. See Figures S2E for a similar analysis across all mice. Right: same as the right panel in A, but KLD values are now computed among the four representative mice depicted in the left panel. Note that values on the diagonal indicate intra-individual variability. E) UMAP plot depicting syllable usage in females for each session color coded by mouse identity. Clustering analysis was performed as described in panel B. For individuals (number of clusters = 16) ARI = 0.43. F) Same as C but for prediction of individual mouse identity. G) Quantification of overall decoder performance (n=1000 restarts for data and shuffled data). Asterisk (*) denotes statistical significance, here indicating that the mean decoding distribution exceeds the 95th percentile shuffle threshold. For all relevant panels, Box plots depict median, interquartile range, and upper/lower adjacent values (black lines). See also Figure S2 and table S1.
