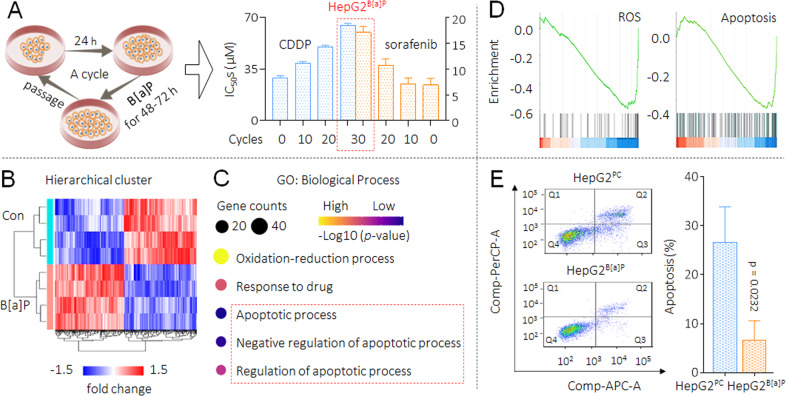
Fig. 1. MDR caused by B[a]P, and the key biological process involved.
A, left The flow chart for the establishment of B[a]P-induced MDR cell model in HepG2 cells. A, right The cell viabilities were determined in triplicate, and the IC50s were calculated. B A heat-map of the DEGs with p < 0.05 and |logFC | > 0.5 in GSE36244 dataset. C GO biological process enrichment analysis of DEGs. D Enrichment plots from GSEA showing the enrichments of ROS and apoptosis-related genes in the DEGs group. E Flow cytometric analyses of the percentage of cells in apoptosis under the treatment of 10.0 μM cisplatin (Q1: necrotic cells, Q2: late apoptosis, Q3: early apoptosis, Q4: living cells). From the histograms, the proportion of cells in total apoptosis (Q2 + Q3) was statistically analyzed.

