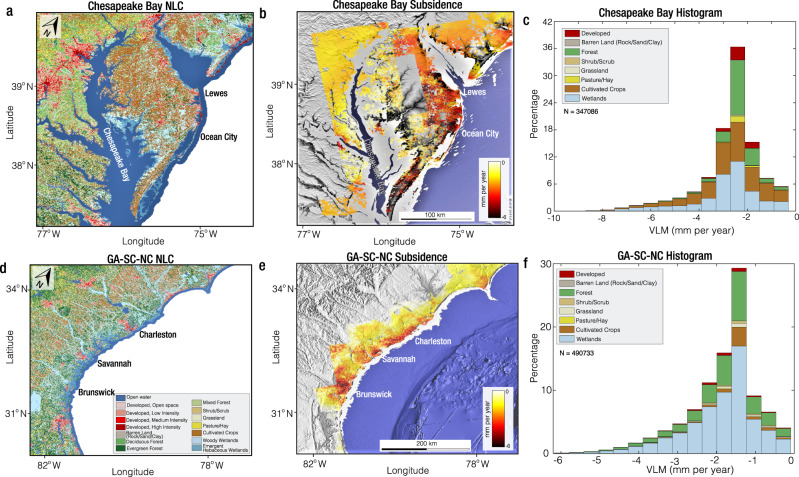
Fig. 4. Examples of regions with significant exposure to land subsidence.
a National land cover (NLC) map for the Chesapeake Bay area29. b Land Subsidence across the Chesapeake Bay area. Background is the global multi-resolution topography (GMRT) made with GeoMapApp (www.geomapapp.org)100. c Frequency distribution of subsidence for different NLC in the Chesapeake Bay area. The percentage of exposure to subsidence and the average subsidence rate for the different NLC are shown in Table 1. N is the number of pixels and VLM is vertical land motion. d NLC map for the Georgia, South Carolina, and North Carolina (GA-SC-NC) area29. e Land Subsidence across the GA-SC-NC coast. Background is GMRT made with GeoMapApp (www.geomapapp.org)100. f Frequency distribution of subsidence for different NLC in the GA-SC-NC area. The percentage of exposure to subsidence and the average subsidence rate for the different NLC are shown in Table 1. N is the number of pixels and VLM is vertical land motion.

