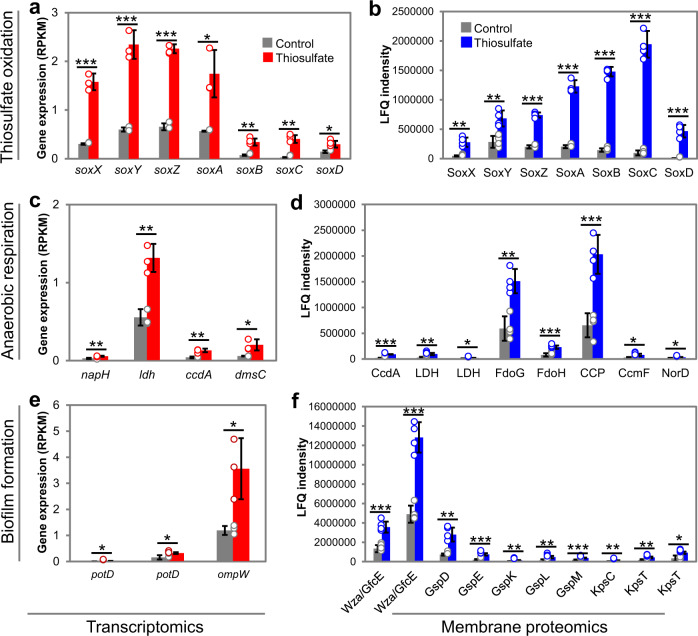
Fig. 5. Transcriptomics and membrane proteomics analyses of the M382 biofilm in response to thiosulfate.
Genes or proteins associated with thiosulfate oxidation (a transcriptomics; b membrane proteomics), anaerobic respiration (c transcriptomics; d membrane proteomics), and biofilm formation (e transcriptomics; f membrane proteomics) are shown. Full names of genes in the transcriptomics results: napH, ferredoxin-type protein; ldh, lactate dehydrogenase; ccdA, cytochrome c-type biogenesis protein; dmsC, anaerobic dimethyl sulfoxide reductase subunit C; potD, spermidine/putrescine transport system substrate-binding protein; ompW, an outer membrane protein. Full names of proteins in the proteomics results: CcdA, cytochrome c-type biogenesis protein; Ldh, lactate dehydrogenase; FdoG, formate dehydrogenase major subunit; FdoH, formate dehydrogenase iron-sulfur subunit; CCP, cytochrome c peroxidase; CcmF, cytochrome c-type biogenesis protein; NorD, nitric oxide reductase. Wza or GfcE, polysaccharide biosynthesis/export protein; GspDEKLM, general secretion pathway proteins; KpsC, capsular polysaccharide export protein; KpsT, capsular polysaccharide transport system ATP-binding protein. In the bar charts, values are shown as mean ± s.d. (n = 3 biologically independent replicates for transcriptomics and n = 4 biologically independent replicates for proteomics). Statistics in both analyses were performed using two-sided Student’s t test with thresholds of fold change >2 and P value <0.05 (*P value <0.05; **P value <0.01; ***P value <0.001). Exact P values in a: 0.0002, 0.0005, 1.7E-05, 0.0136, 0.0031, 0.0013, 0.0225; b: 0.0011, 0.0032, 7.5E-07, 1.5E-06, 7.8E-08, 3.8E-06, 0.0001; c: 0.0067, 0.0032, 0.0039, 0.0251; d: 4.5E-05, 0.0014, 0.0173, 0.0015, 0.0006, 0.0008, 0.0183, 0.0120; e: 0.0469, 0.0353, 0.0255; f: 0.0006, 0.0001, 0.0013, 0.0002, 0.0053, 0.0075, 0.0004, 0.0048, 0.0023, 0.0112. Source data are provided as a Source data file.

