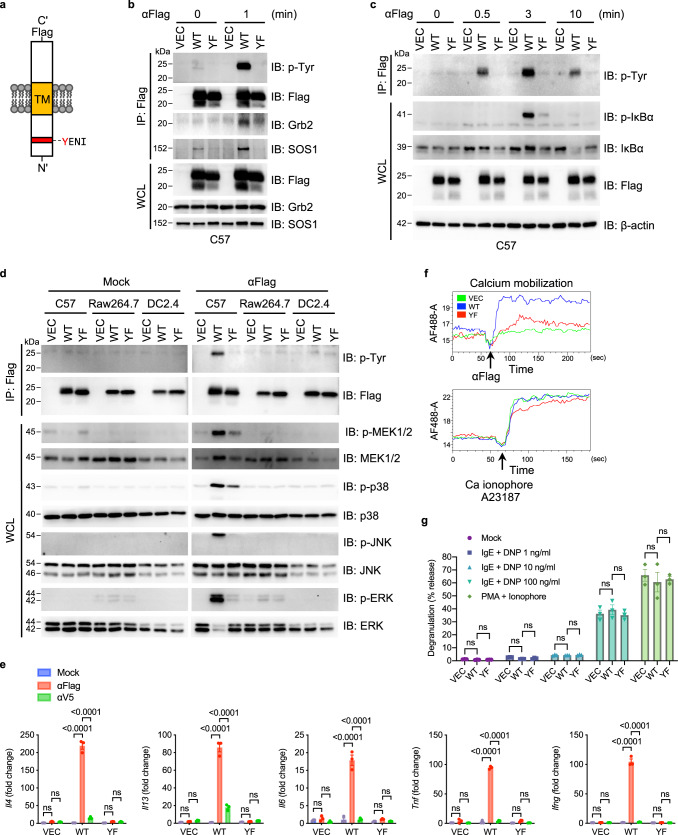
Fig. 1. MCEMP1 has an ITAM-dependent signal-transducing activity in mast cell.
a Schematic diagram of MCEMP1 structure. ITAM motif, YENI; TM, transmembrane. b MCEMP1 tyrosine phosphorylation and its interaction with Grb2 and SOS1. C57 cells expressing vector (VEC), wild-type MCEMP1 (WT), or tyrosine to phenylalanine mutant MCEMP1 (YF) were treated with αFlag for 1 min and cell lysates were immunoprecipitated (IP) with anti-Flag antibody. Immunoprecipitates and whole cell lysates (WCL) were analyzed by immunoblotting (IB) with the indicated antibodies. The upper band of MCEMP1 is a glycosylated form. c IP and IB analysis of MCEMP1 phosphorylation and downstream NF-κB signaling in C57 cells. d Mast cell-specific activation of MCEMP1 and downstream MAPK signal transduction in C57, Raw264.7, or DC2.4 cells. e Gene expression of Il4, Il13, Il6, Tnf, and Ifng in C57 cells after αFlag treatment. Mock or αV5 antibody was treated as negative controls. f Intracellular calcium influx upon αFlag-mediated MCEMP1 activation. Calcium Ionophore was used as a positive control. g β-hexosaminidase assay measuring mast cell degranulation. PMA + ionophore (positive control); dinitrophenyl (DNP) + α-DNP-IgE (FcεRI activation). Data are representative of at least two independent experiments in b–f. Data are presented by mean±s.e.m. and p-values were determined by two-way ANOVA with Tukey’s comparison in g (n = 3) and e (n = 3). ns, not significant.

