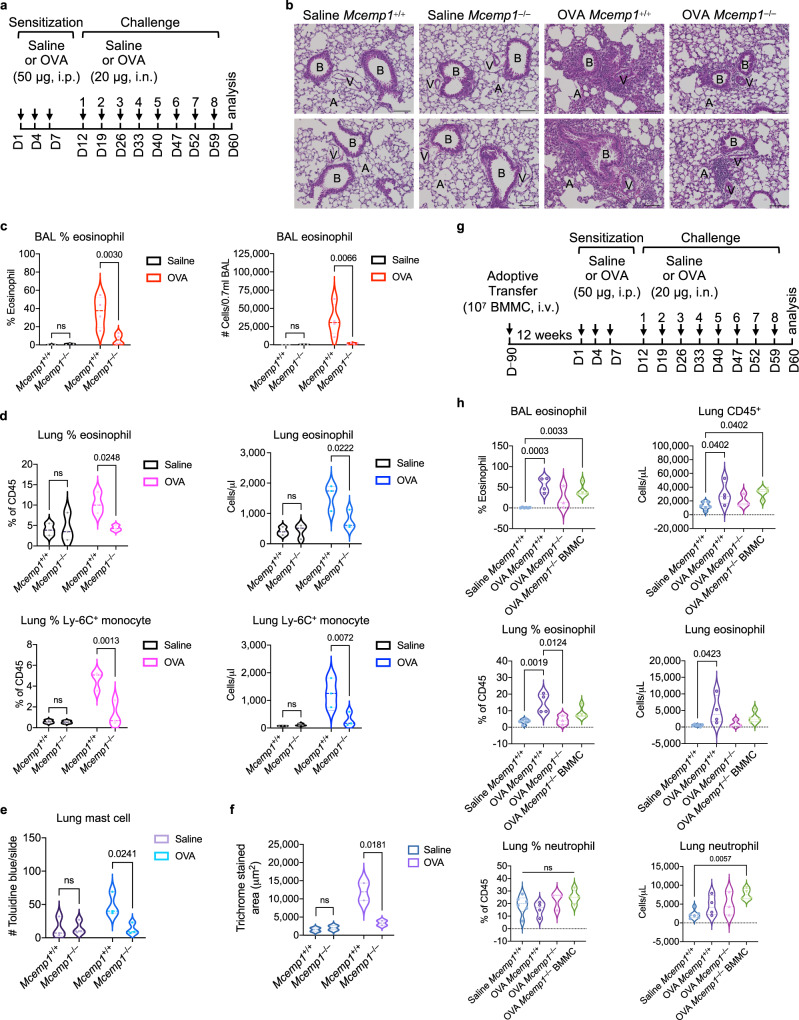
Fig. 5. MCEMP1 deficiency attenuates OVA-induced lung inflammation.
a Schematics of ovalbumin (OVA)-sensitized and challenged chronic asthma model. Mcemp1+/+ and Mcemp1–/– mice were sensitized with saline or 50 μg OVA via intraperitoneal (i.p.) injection and challenged with saline or 20 μg OVA via intranasal (i.n.) instillation on the indicated days. b Representative images of hematoxylin and eosin staining for histological analysis of lungs. B, bronchiole; A, alveoli; V, blood capillary. Scale bar, 100 μm. c Percentages and absolute numbers of eosinophils in bronchoalveolar lavage (BAL) were determined by manual counting and by differential counts on cytospin slides (n = 3 for saline group, n = 4 for OVA group). d Percentages and absolute numbers of eosinophils and Ly-6C+ inflammatory monocytes in the lungs were determined by flow cytometry (n = 3 per group). e Average numbers of toluidine blue positive mast cells per slide (n = 3 slides per group) were quantified by ImageJ. f Quantification of Masson’s trichrome staining (n = 2 slides per group) by Image-Pro 10. g Schematics of BMMC adoptive transfer and OVA-induced chronic asthma model. h Percentages and/or absolute numbers of BAL eosinophils, lung CD45+ leukocytes, eosinophils and neutrophils were determined by flow cytometry (n = 6 for saline group. n = 3-4 for OVA group). Data are presented as violin plots with lines at median and quartiles and p-values were determined by two-way ANOVA with Sidak’s multiple comparison in c, d, e, f or by one-way ANOVA with Tukey’s multiple comparison in h. ns, not significant.

