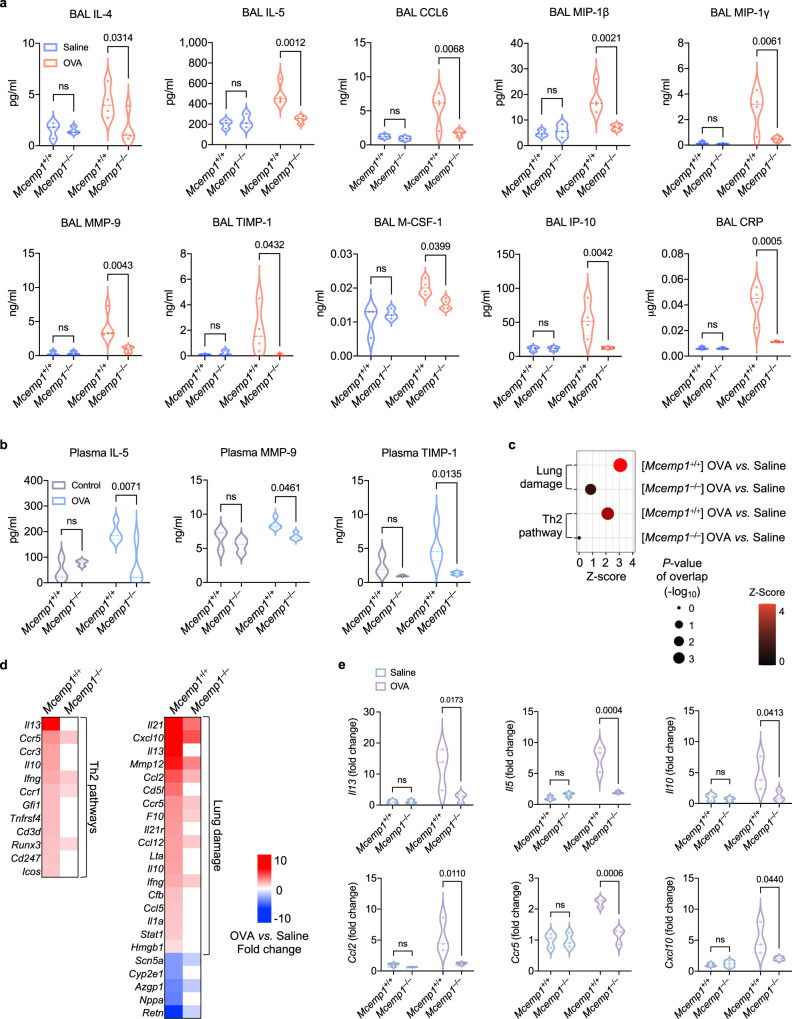
Fig. 6. MCEMP1 deficiency diminishes asthma-associated inflammatory gene expression.
a, b Cytokine and growth factor levels in the BAL and plasma were determined by multiplex analysis (n = 3 for saline group, n = 4 for OVA group). c A dot plot of comparison analysis of OVA-challenged versus saline-treated Mcemp1+/+ mice in comparison with OVA-challenged versus saline-treated Mcemp1–/– mice. The color bar indicates z-score of a predicted activation in the indicated pathway. The size of each dot corresponds to the p-value of overlap (right-tailed Fisher’s Exact Test). d Heatmaps of significantly upregulated and downregulated genes in OVA-challenged versus saline-treated Mcemp1+/+ mice in comparison with OVA-challenged versus saline-treated Mcemp1–/– mice. Red, white, and blue indicate induction, no change, and repression, respectively. e Gene expression of Il13, Il5, Il10, Ccl2, Ccr5, and Cxcl10 in Mcemp1+/+ mice or Mcemp1–/– mice after saline or OVA challenge. Data are presented as violin plots with lines at median and quartiles and p-values were determined by two-way ANOVA with Sidak’s multiple comparison in a, b, e. ns, not significant.

