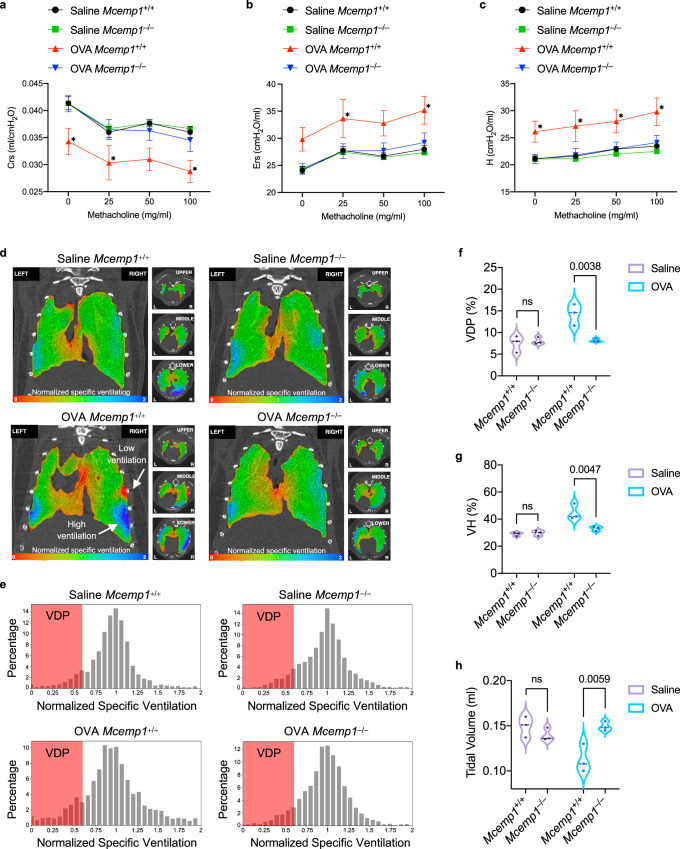
Fig. 7. MCEMP1 deficiency ameliorates lung compliance and airflow in OVA-induced chronic asthma.
a–c Lung function parameters; compliance (Crs), elastance (Ers) of respiratory system, and tissue elastance (H) in response to the indicated concentrations of methacholine were measured 1 day after the eighth intranasal challenge with OVA or saline (n = 3-4 per group). d Representative images of 4DMedical lung scanning for regional ventilation visualization across the lung over a full inhalation. One coronal slice and three axial slices of upper, middle, and lower lungs of Mcemp1+/+ or Mcemp1–/– mice challenged with OVA or saline. The color bar indicates the degree of ventilation as low in red and high in blue. e Representative histogram of 4DMedical ventilation frequency distribution. VDP, ventilation deficit percent. f–h Ventilation metrics; VDP, ventilation heterogeneity (VH), and tidal volume (n = 3 per group). Data are presented as mean±s.d. in a, b, c and as violin plots with lines at median and quartiles in f, g, h. P-values were determined by two-way ANOVA with Dunnett’s multiple comparison in a, b, c and by two-way ANOVA with Sidak’s multiple comparison in f, g, h. *P < 0.05 (Crs, the p-values for 0, 25, and 100 mg/ml methacholine are 0.0115, 0.034, and 0.0444, respectively; Ers, the p-values for 25 and 100 mg/ml methacholine are 0.0442 and 0.0286, respectively; H, the p-values for 0, 25, 50, and 100 mg/ml methacholine are 0.0361, 0.0425, 0.0346, and 0.0157, respectively). ns, not significant.

