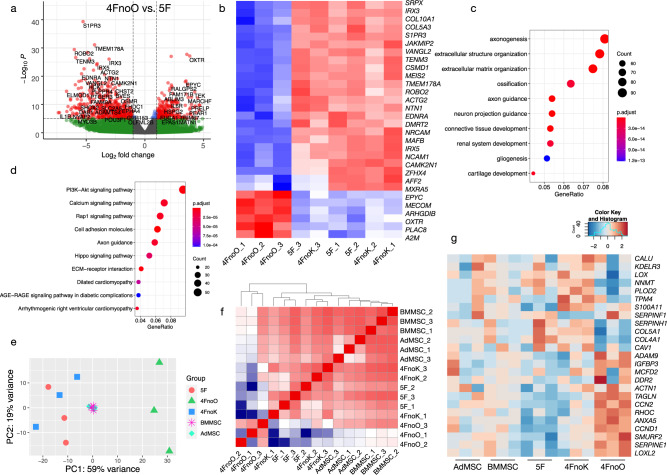
Fig. 4. Comparative transcriptome analysis of iMSCs reprogrammed from PBMCs.
a Volcano plot showing differentially expressed genes identified in 4FnoO iMSCs compared with 5F iMSCs. Each dot represents a gene. The red dots are genes significantly upregulated (right) or downregulated (left) in 4FnoO iMSCs (Cutoff: P < 10e−6, fold change > 2). b Heatmap showing the top 30 differentially expressed genes between 5F iMSCs and 4FnoO iMSCs (ranked by p-value). c, d Dot plots showing the top Gene Ontology (GO) biological process (BP) terms (c) and KEGG pathways (d) enriched from DEGs in 4FnoO iMSCs compared to 5F iMSCs. e PCA of RNA-seq from iMSCs 4 weeks after reprogramming with 5F, 4FnoO, or 4FnoK, primary human bone marrow-derived MSCs (BMMSC) and primary adipose-derived MSCs (AdMSC). For each condition, iMSCs were reprogrammed from PBMCs derived from three biologically independent donors. f Pearson correlation analysis of iMSCs and primary MSCs. g Comparison of twenty-four genes previously determined to be specific to the MSC lineage between primary MSCs and iMSCs.

