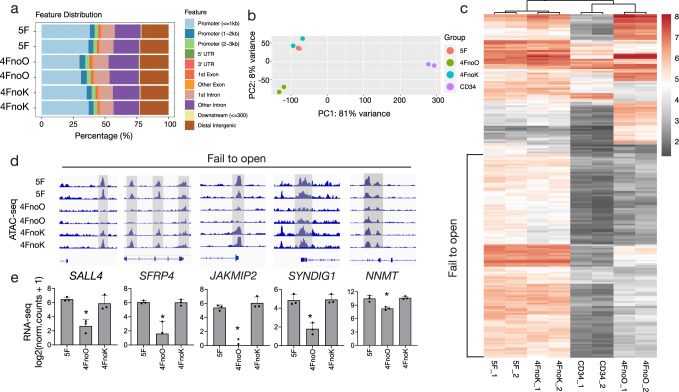
Fig. 5. Chromatin accessibility analysis of iMSCs reprogrammed with different factor combinations.
a Genomic location of ATAC-seq peaks from 5F, 4FnoO, and 4FnoK iMSCs. b PCA using normalized ATAC-seq counts from 5F, 4FnoO, and 4FnoK iMSCs, and two datasets from bone marrow-derived CD34+ cells (SRR2920489 and SRR2920490). For each condition, the chromatin accessibility was profiled from iMSCs that were reprogrammed from two biologically independent donors. c Heatmap showing ATAC-seq signals with the top 200 most different peaks (ranked by padj). Red represents chromatin regions with more mapped reads, suggesting possible chromatin openness. Gray represents chromatin regions with fewer mapped reads, suggesting closed chromatin. d Selected genomic views of the ATAC-seq data using IGV (2.8) for the indicated groups. For each gene, all genome views are on the same vertical scale. e The bar plot showing RNA-seq gene expression values for the respective genes shown above in the genome view. RNA-seq gene expression levels are shown as log2() normalized read counts. n = 3 biologically independent samples for each group. *P ≤ 0.05; error bars indicate standard deviation.

