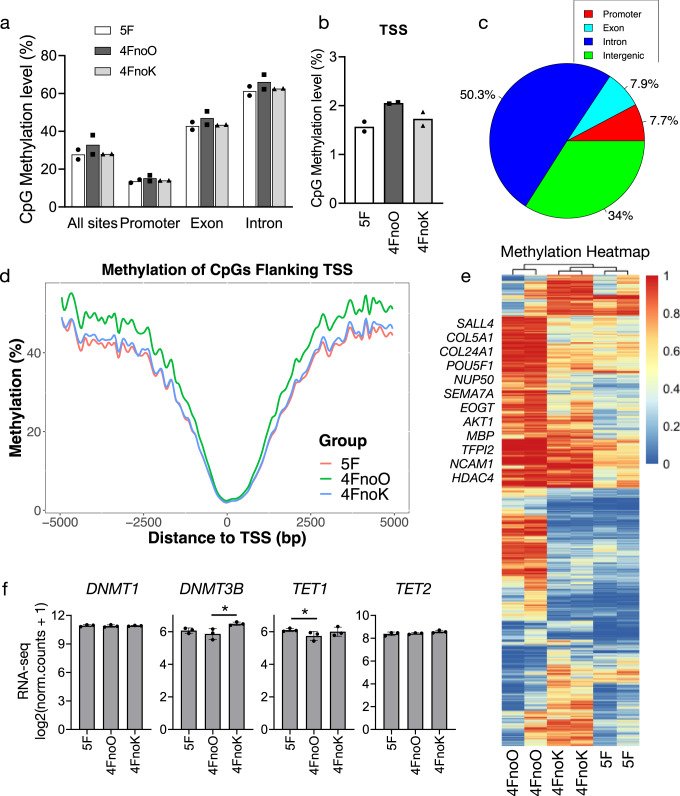
Fig. 6. Genome-wide DNA demethylation induced by OCT4 during PBMC reprogramming.
a The bar graph showing the methylation levels of all sites, promoters, exons, and intron regions from 5F, 4FnoO, and 4FnoK iMSCs. n = 2 biologically independent samples for each group. b The methylation levels of the TSS region. n = 2 biologically independent samples for each group. c The percentage of differentially methylated CpGs (DMCs) between 5F and 4FnoO iMSCs annotated within the promoter, exon, intron, and intergenic regions shown in the pie chart. d The average methylation levels surrounding the TSSs (−5000 to +5000 bp) in 5F, 4FnoO, and 4FnoK iMSCs. e Hierarchical clustering and heatmap analysis of 13,974 DMCs. f The bar plot showing the log2() normalized read counts from RNA-seq. n = 3 biologically independent samples for each group. *P < 0.05; error bars indicate standard deviation.

