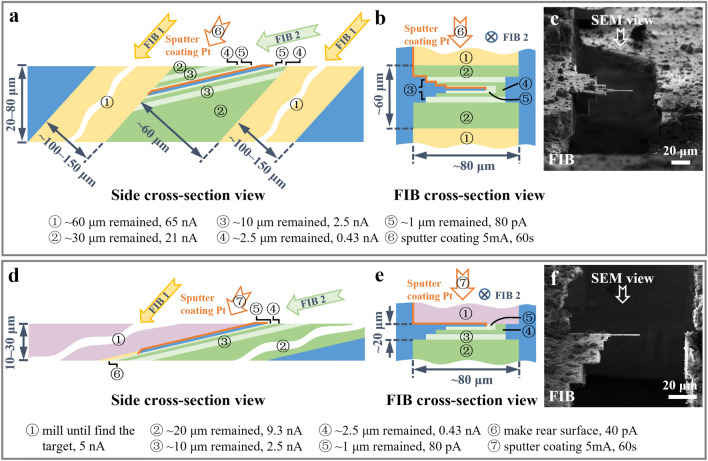
Figure 3.
Coarse milling procedure. (a and b) Schematic diagrams of a typical coarse milling procedure viewed from the side (a) and FIB cross-section view (b). The yellow and green (light and dark green) strips represent the first and the second sub-steps, respectively, with milling along different ion beam directions (arrows labeled with FIB 1 and FIB 2). (c) Image of a liver sample under FIB view after the coarse milling presented in (a and b). (d) and (e), Schematic diagrams of a typical coarse milling procedure skipping the first sub-step to avoid damage on the lamella surface for initial CSEI-based localization. The purple strips represent the volumes removed for CSEI-based localization along the ion beam direction of FIB 2. (f) Image of a liver sample under FIB view after the coarse milling presented in (d and e). The strips with different colors and numbers in circles indicate different milling steps and milling parameters (listed at the bottom). The numbers also indicate the sequence of milling and sputter Pt coating (orange edges). The blue volumes and strips are the remaining materials and the final lamella. The FIB images in (e and f) were acquired using Helios (FEI Company).

