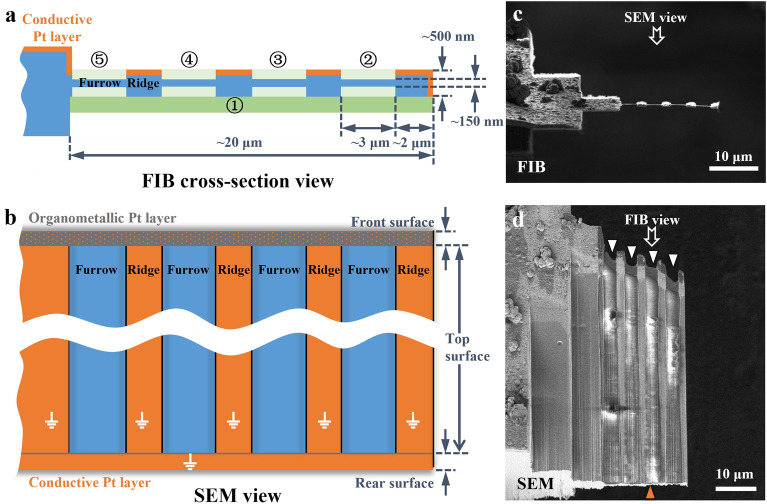
Figure 4.
Fine milling procedure and furrow–ridge structure. (a and b) Schematic diagrams of the fine milling procedure under FIB cross-section view (a) and SEM view (b). The green strips (dark green and light green) represent the volumes removed in the sequence indicated by the numbers in circles. The orange edges and surfaces indicate the conductive Pt layer. The gray surface is the organometallic Pt layer coated by a gas injection system (GIS). The orange dots on the front surface indicate the conductive Pt layer which might be damaged during fine milling. The front, top, and rear surfaces are defined in Supplementary Fig. 6. The blue volumes and surfaces are the remaining materials. (c) and (d) Finished lamella of a liver sample created by fine milling under FIB view (c) and SEM view (d), as presented in (a) and (b), respectively. The FIB and SEM images in (c and d) were acquired using Helios (FEI Company).

