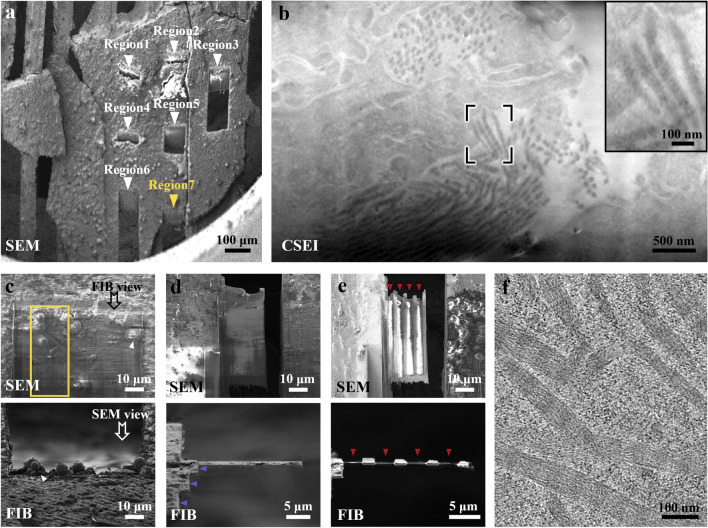
Figure 6.
Complete workflow illustrated using a mouse liver sample. (a) Pre-sectioned and frozen liver slice under SEM view. Seven regions (arrows) were created for CSEI-based localization. (b) Region 7 in (a) was viewed by CSEI, showing the target collagen fibrils. The inset image shows magnified fibrils in the black box. (c) The top surface of the lamella was milled during CSEI-based localization. The yellow box is the target area. Ice contamination (white arrows) was produced when transferred to another cryoFIB instrument for further milling. (d) The liver tissue was coarsely milled to reduce the target area to ~ 1 µm thick. Blue arrows show the stepped edge on one side of the lamella. (e) The final lamella after fine milling. Red arrows show the furrows. (f) A section-view of a tomogram showing collagen fibrils (Supplementary Movie 2). The imaging method, SEM or FIB, is labeled in the bottom-left of each panel. Crossbeam 550 (ZEISS Microscopy) was used for CSEI-based localization; Helios (FEI Company) was used for further cryoFIB milling procedure.

