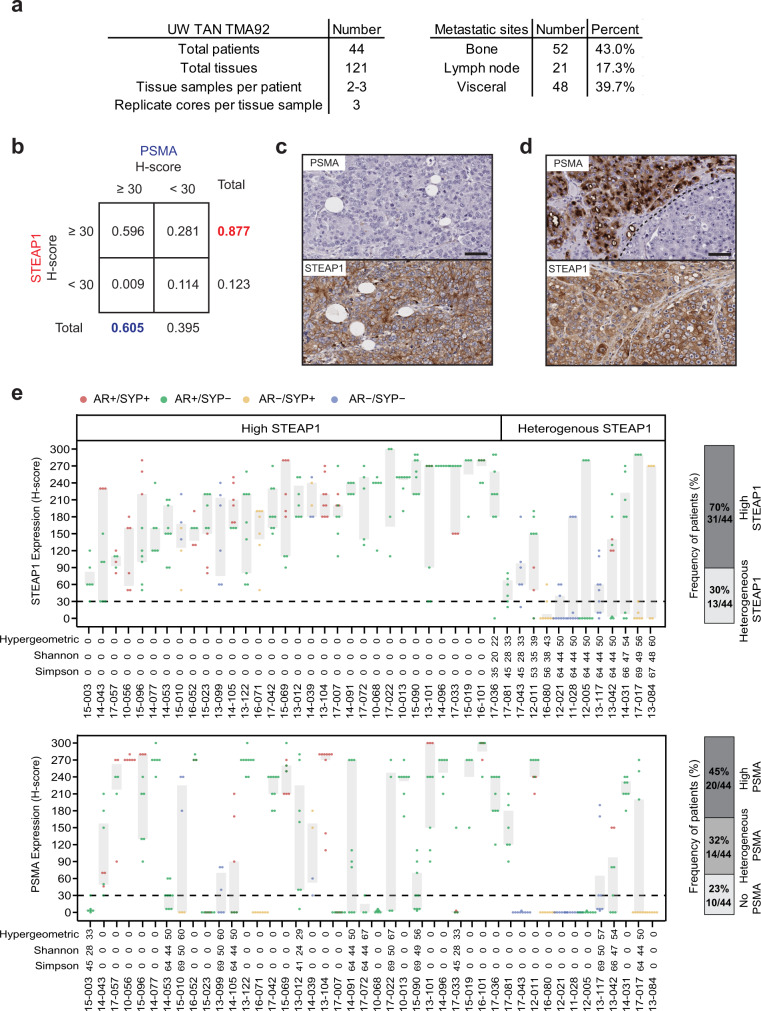
Fig. 1. Comparative analysis of STEAP1 and PSMA in lethal, metastatic castration-resistant prostate cancer (mCRPC).
a Characteristics of the mCRPC tissues represented on University of Washington Tissue Acquisition Necropsy Tissue Microarray 92 (UW TAN TMA92). b Contingency table showing the frequency of mCRPC tissues with STEAP1 or PSMA IHC staining above or below an H-score threshold of 30. Micrographs of select mCRPC tissues after STEAP1 and PSMA IHC staining to highlight the (c) absence of PSMA but presence of STEAP1 expression and (d) intratumoral heterogeneity of PSMA expression but not STEAP1. Scale bars = 50 µm. For panels (c, d) n = 332 mCRPC cores were immunostained for STEAP1 and PSMA. e Dot and box plot showing the distribution of STEAP1 (top) and PSMA (bottom) H-scores in 44 patients from the UW TAN TMA92 cohort. Each dot represents a tumor specimen/core (n = 319 cores for PSMA and 333 cores for STEAP1) and the color indicates the molecular subtype: AR+/SYP+ (red), AR+/SYP− (green), AR−/SYP+ (yellow) and AR−/SYP− (purple). Gray rectangles show interquartile ranges spanning the 25th to the 75th percentiles of PSMA H-scores from each patient. Bar plots (on the right) summarize the frequencies of patients classified based on STEAP1 and PSMA expression as no expression (all cores with H-score ≤30, light grey), heterogeneous expression (at least one core with H-score ≤30 and H-score >30, mid grey) and high expression (all cores with H-scores >30, dark grey). Source data are provided in the Source Data file.

