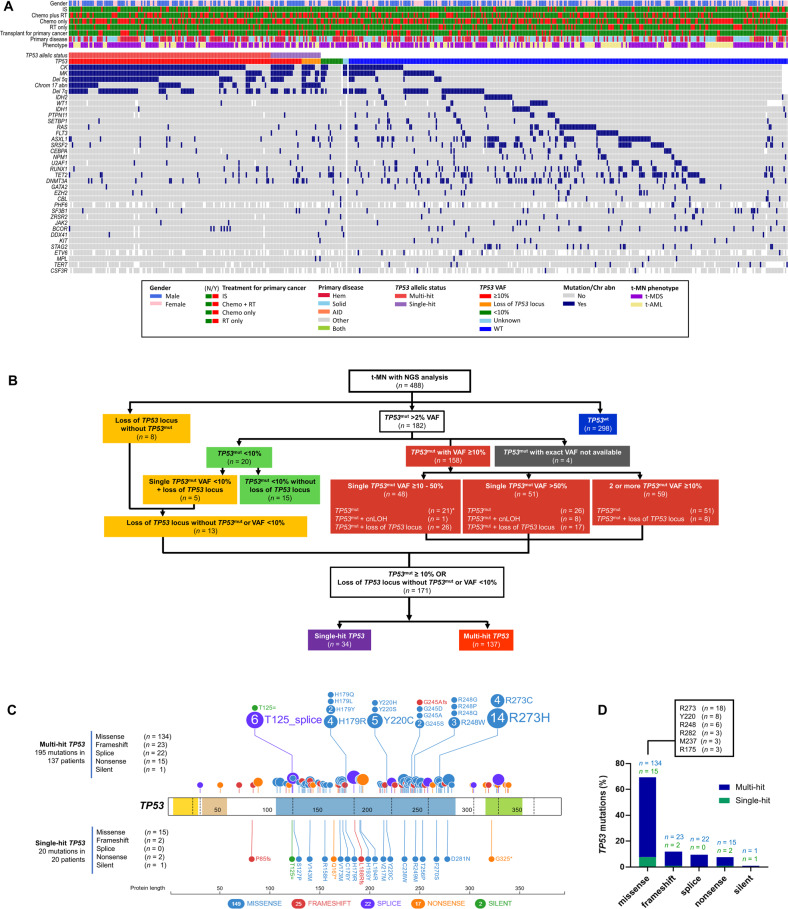
Fig. 1. Landscape of TP53 mutation (TP53mut) in therapy-related myeloid neoplasms (t-MN).
A Oncoplot showing cytogenetic and mutational landscape of TP53mut and wild-type TP53 (TP53wt) t-MN. Patient-related factors (t-MN phenotype, abnormal karyotype, primary disease, treatment status, and gender) are shown in the upper panel, and the distribution of somatic gene mutations (including TP53 mutation status) in the lower panel. Each column represents an individual patient, and the presence of the aberration or mutation is colored as indicated above; B Consort diagram of the mutant TP53 status of 488 t-MN patients analyzed by integrated analysis employing next gene sequencing (NGS), conventional cytogenetics, FISH, SNP-array and CNA analysis. *Of the 48 patients with single TP53mut VAF 10–50% LOH information was available in 33 patients. Importantly, 80% of the remaining TP53mut patients (n = 15) without LOH information has complex karyotype and are considered equivalent to multi-hit by ICC; C Distribution of TP53mut along the gene. Mutations from single-hit patients are shown at the bottom and those from multi-hit patients are shown at the top. Missense mutations are shown as blue circles, truncated mutations corresponding to nonsense mutations as orange circles, frameshift deletions or insertions as red circles, and splice site variants are shown as purple circles. Other types of mutations are shown as green circles. Functional protein domains are indicated in yellow (transactivation motif), brown (transactivation domain 2), blue (DNA binding domain), and green (tetramerization motif); D Summary of TP53mut separated by mutation type and frequency of the mutations.

