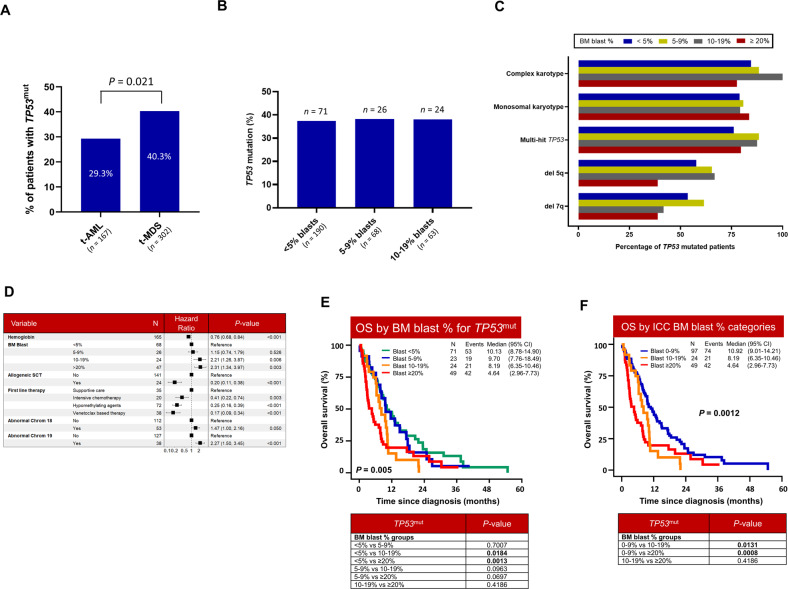
Fig. 4. Interaction between TP53mut and bone marrow (BM) blast percentage.
A Distribution of t-AML and t-MDS according to TP53mut status; B TP53mut frequency in t-MDS was similar across blast categories at diagnosis; C Chromosomal aberrancies and TP53mut allelic status across BM blast %; D Multivariate Cox-regression analysis showing BM blast >10%, chromosomal 18/19 abnormalities and disease modifying therapies were independent predictors of TP53mut OS; E In TP53mut t-MN, BM blast 10–19% and ≥20% were associated with poor OS compared to BM blast <5%; (F) OS of TP53mut t-MN according to ICC blast categories (0–9% vs. 10–19% vs. ≥20%).

