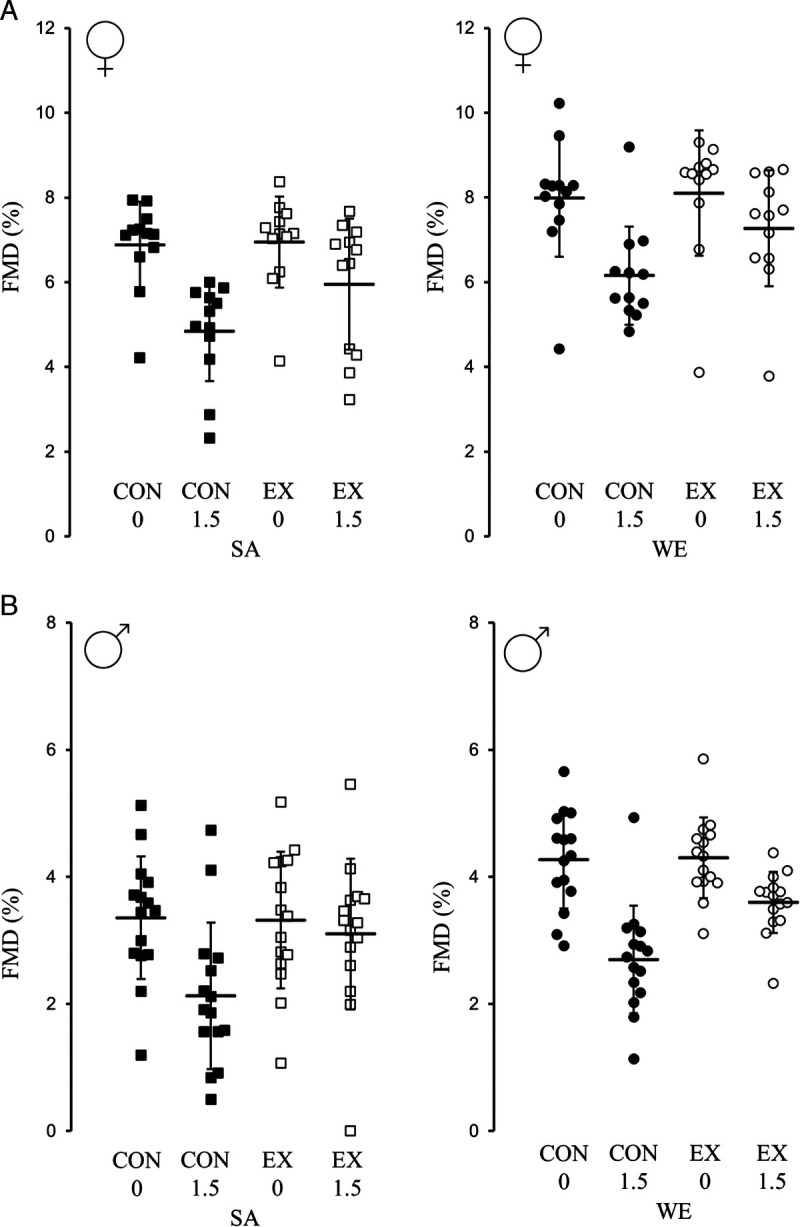
FIGURE 2.

Day 2 individual FMD% changes in brachial artery diameter in the control and exercise trials for SA and WE women who were lean (A; n = 12 in both groups), and SA and WE men with central obesity (B; n = 15 in both groups). Data presented as the mean (SEM). CON, control; EX, exercise; FMD%, relative flow-mediated dilatation; 0, fasted; 1.5, 1.5 h postprandial.
