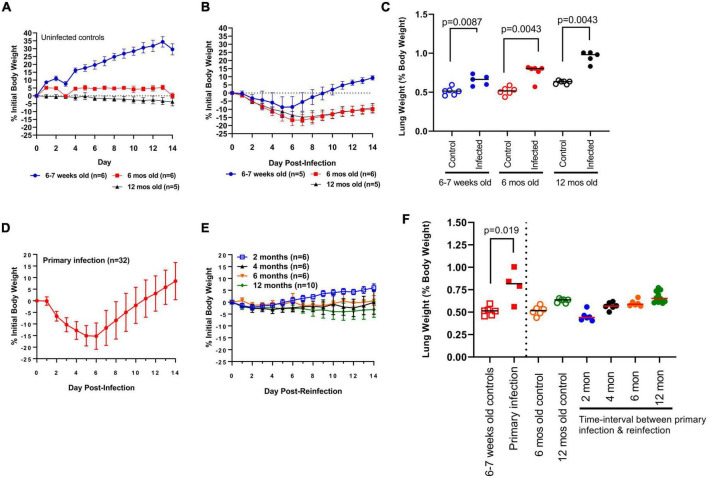
FIGURE 2.
Clinical indications of disease. (A) Change in daily bodyweight for young (6–7 week-old) and mature (6- and 12 month-old) hamsters in the absence of infection. (B) Change in bodyweight in young (6–7 week-old) and mature (6- and 12 month-old) hamsters after primary infection with SARS-CoV-2 ancestral Wuhan strain. (C) Lung weight (as percent bodyweight) in young (6–7 week-old) and mature (6- and 12 month-old) hamsters after primary infection with SARS-CoV-2. Lung weights were measured at Day 14 post-infection. Each dot represents lung weight ratio for a single hamster, black horizontal bar represents group median. (D) Change in bodyweight in young (6–7 week-old) hamsters after primary infection and (E) reinfection at regular time-intervals with SARS-CoV-2. (F) Lung weight (as percent bodyweight) in young (6–7 week-old) and mature (6- and 12 month-old) hamsters in response to primary infection (solid squares) and reinfection (solid circles). Lung weights were measured at Day 14 post-challenge. Age-matched controls for young hamsters (open squares) and mature hamsters (6- and 12 month-old; open circles) are shown. Horizontal bars represent group median, each dot represents the lung weight ratio for a single hamster. Bodyweight data in panels (A,B,D,E) are expressed as changes to initial bodyweight prior to challenge, where dots represent the group mean and error bars represent one standard deviation. P-values were calculated using Mann Whitney test or Kruskal-Wallis one-way ANOVA.

