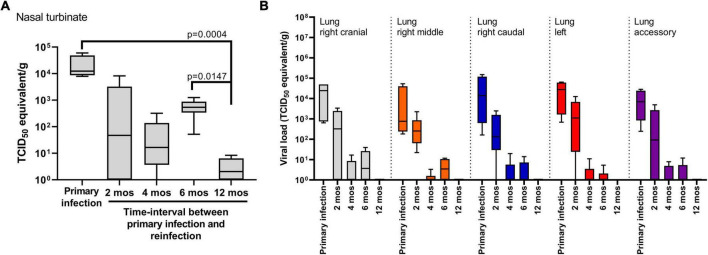
FIGURE 4.
SARS-CoV-2 viral load in respiratory tissues. Viral RNA levels detected in (A) nasal turbinate and (B) lung tissues. Tissues were harvested at 14 days post-challenge in the primary infection cohort (n = 4) and in the cohorts reinfected at 2, 4, 6 (n = 6/time-point) and 12 months (n = 10). No live virus was recovered from tissue samples belonging to the primary infection cohort or the reinfection cohorts at 14 days post-challenge. Each boxplot represents the median (interquartile range), error bars display min and max values. P-values were determined using Kruskal-Wallis one-way ANOVA.

