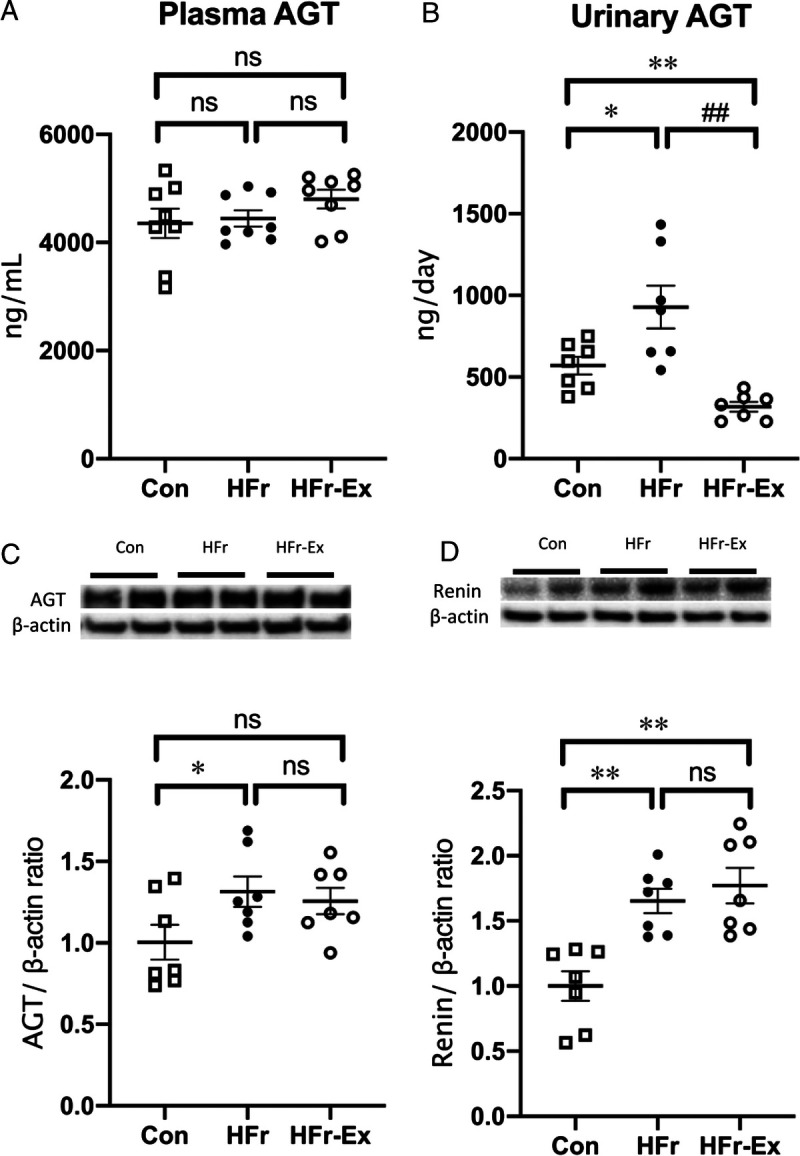
FIGURE 4.

Levels of AGT in plasma and urine and expression of AGT and renin in the renal cortex of DS rats. The levels of plasma AGT (A) and urinary AGT (B) were compared among the Con, HFr, and HFr–Ex groups. The renal expression of AGT (C) and renin (D) were compared among the Con, HFr, and HFr–Ex groups. Top panels depict representative immunoblots from the different groups. The intensities of each specific protein band were normalized to that of β-actin, and the mean intensities of the values for the Con group. Data are presented as means ± SEM for n = 8 rats per group. *P < 0.05, **P < 0.01 compared with the Con group; #P < 0.05, ##P < 0.01 compared with the HFr group.
