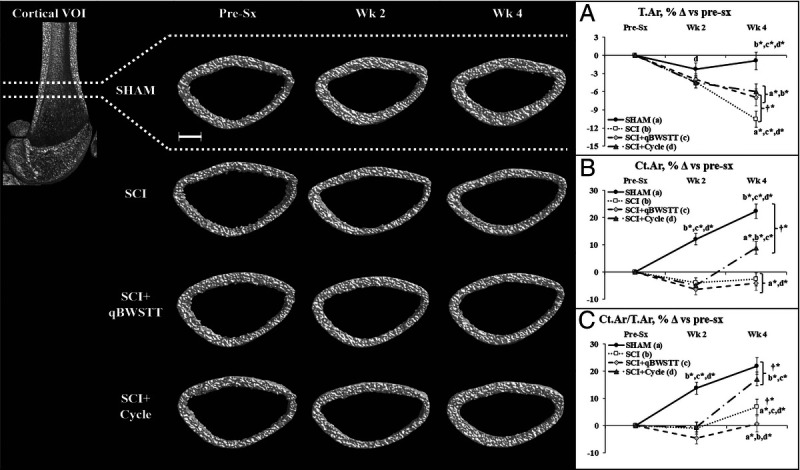
FIGURE 3.

A–C, Representative cortical bone microstructural images (left panel) and cortical microstructural data (A–C) at the distal femur cortical VOI acquired via in vivo microCT before surgery (pre-sx) and 2 and 4 wk after rats received T9 laminectomy (SHAM), T9 laminectomy plus SCI, SCI plus qBWSTT (SCI + qBWSTT), or SCI plus passive-isokinetic bicycle training (SCI + Cycle). Values are estimated marginal means ± SEM of the percent change from pre-sx, n = 11–15/group. Some error bars are within the size of the symbol. † indicates within-group difference for 2 vs 4 wk. Letters indicate difference vs respectively labeled groups (a = vs SHAM, b = vs SCI, c = vs SCI + qBWSTT, and d = vs SCI + Cycle) at P < 0.05 or *P < 0.01. Scale bar, 1 mm. Complete statistical findings are in Supplemental Table 2 (Supplemental Digital Content, Statistical outcomes and treatment effects for variables assessed at multiple time points, http://links.lww.com/MSS/C771).
