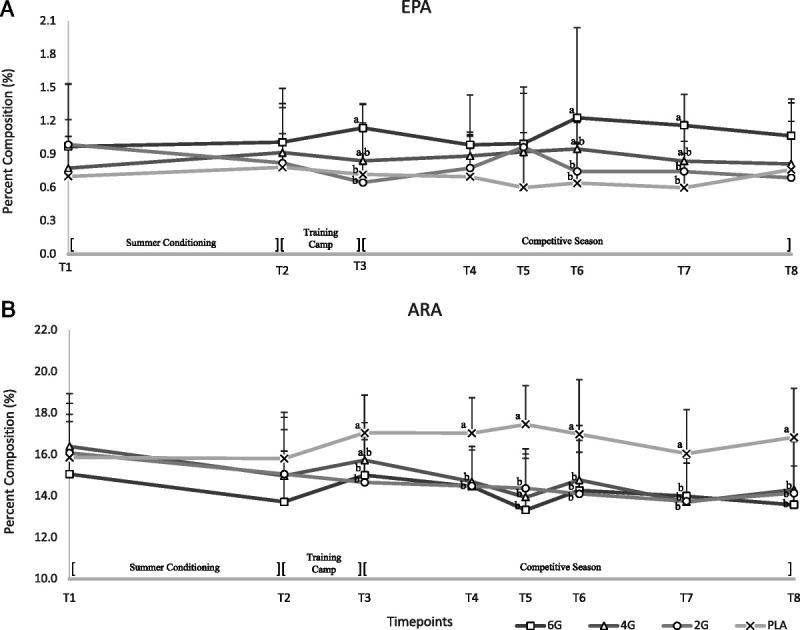
FIGURE 4.

Dose–response of (A) EPA and (B) ARA after DHA supplementation between all treatment groups over the course of a competitive college football season. A mixed-model repeated-measures approach showed a significant (P < 0.05) effect of dose and time for EPA and ARA. Subsequently, a one-way ANOVA was conducted at each time point followed by Tukey post hoc to determine differences between means (P < 0.05). Letters indicate groups statistically significant from each other at that time point (P < 0.05); time points without letters indicate no statistical difference. Error bars represent SD.
