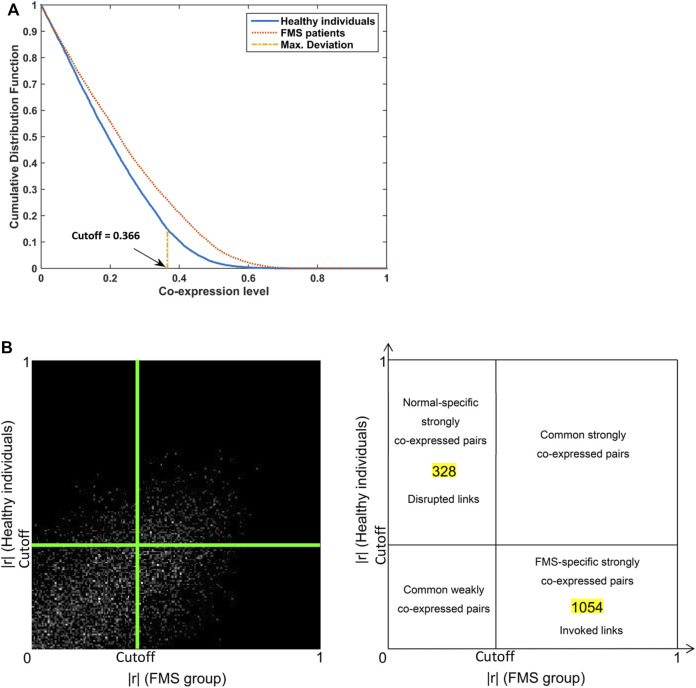
FIGURE 2.
Co-expression patterns for genes involved in pain signaling pathway. (A) Cumulative distribution plots in the FMS and healthy individuals. The FMS-specific cutoff point 0.366 was identified. (B) Co-expression galaxy (left) and four regions (right) partitioned by the cutoff point. Each absolute correlation coefficient (|r|) was represented by one white dot in the galaxy. More dots demonstrated that more correlation coefficients located in that region. FMS, Fibromyalgia syndrome.

