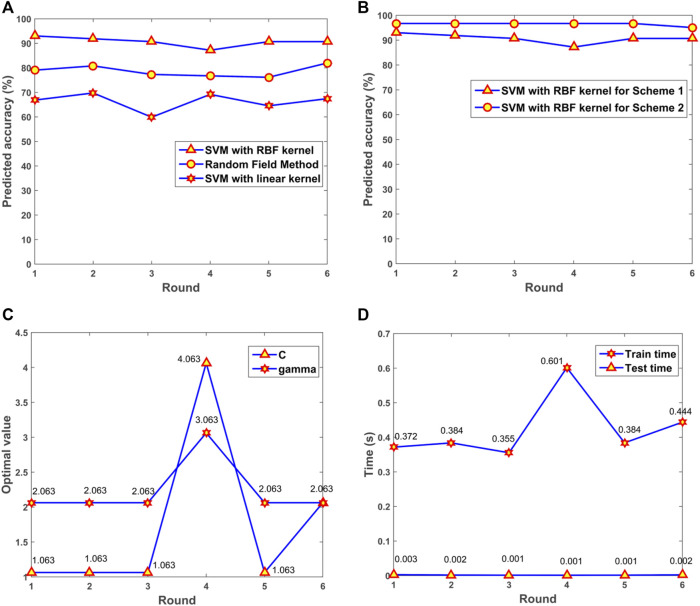
FIGURE 8.
The performance of the model. (A) Predicted accuracy of the model with different kernels. (B) Predicted accuracy with different cross-validation schemes. (C) The optimal gamma and C in the 6-fold cross-validation. (D) Consuming time for training and testing processes. SVM, support vector machine; RBF, radial basis function.

