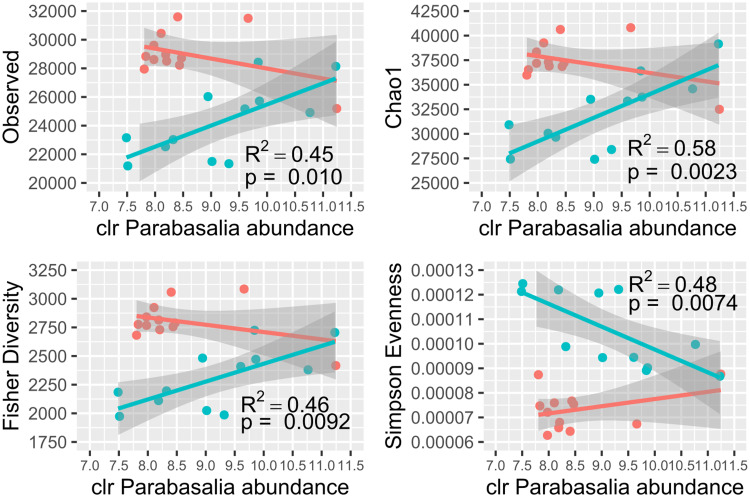
Fig. 6.
Relationship between Parabasalia abundance (normalized by centred log-ratio; clr) and microbial diversity metrics. Observed refers to the total number of observed taxa. Macaques with idiopathic chronic diarrhoea (ICD) and healthy controls are shown in pink and turquoise, respectively. Lines indicate separate linear regressions fitted for the ICD and control groups, and the shaded areas indicate 95% confidence intervals. The significant linear regression P values (<0.05) and corresponding R2 values derived from the ICD sample are indicated next to the corresponding line. The linear regression results for the control macaques were not significant (P value >0.05).

