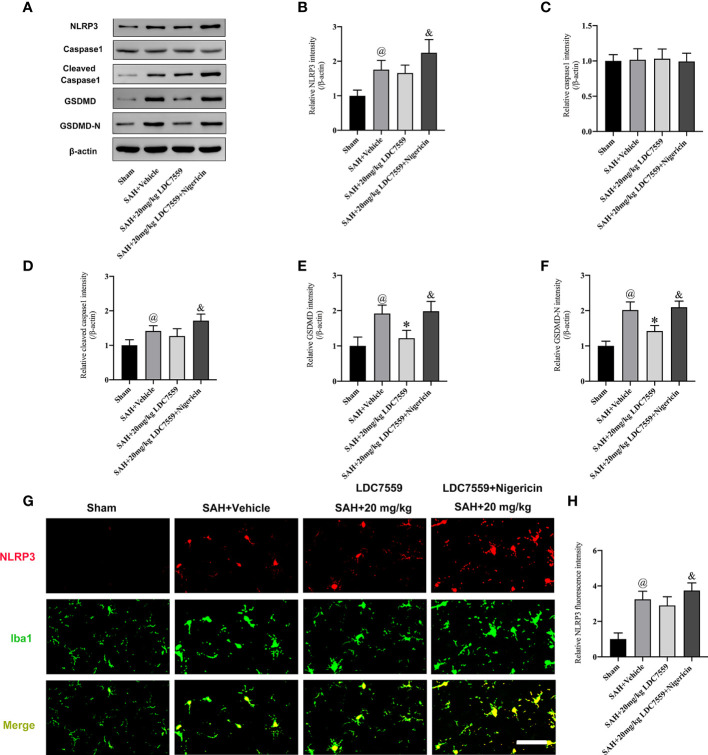
Figure 4.
LDC7559 Treatment Inhibited GSDMD-mediated Signaling after SAH. Representative western blot bands (A) and quantification of the protein levels of NLRP3 (B), caspase-1 (C), cleaved caspase-1 (D), GSDMD (E), and cleaved GSDMD (F) (n = 6 per group). Representative immunofluorescence microphotographs of NLRP3 staining (G) in the ipsilateral hemisphere. Scale bar = 50 μm. Measurement of NLRP3 staining in the ipsilateral hemisphere (H) (n = 6 per group). Values are presented as the mean ± SD. @ P < 0.05 compared with sham group, *P < 0.05 compared with SAH + vehicle group, & P < 0.05 compared with SAH + 20mg/kg LDC7559 group.

