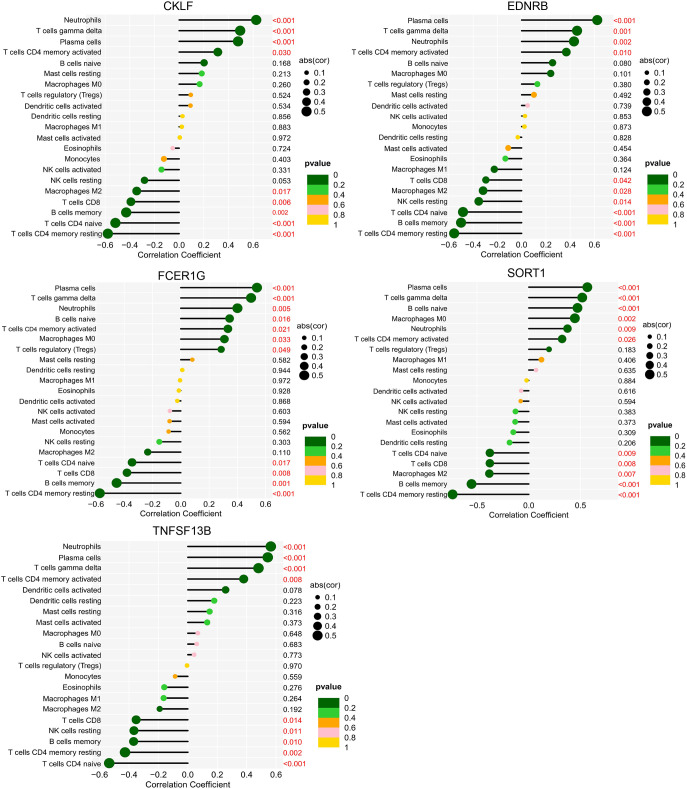
Figure 13.
Correlation between biomarkers and immune cells in SCI. The ordinate on the left represents the proportion of immune cells, the ordinate on the right represents the P value of the correlation test, and the abscissa represents the correlation coefficient. The size of the circle represents the correlation coefficient, and the color of the circle represents the P value of the correlation test; a P value<0.05 was considered statistically significant. SCI, spinal cord injury.

