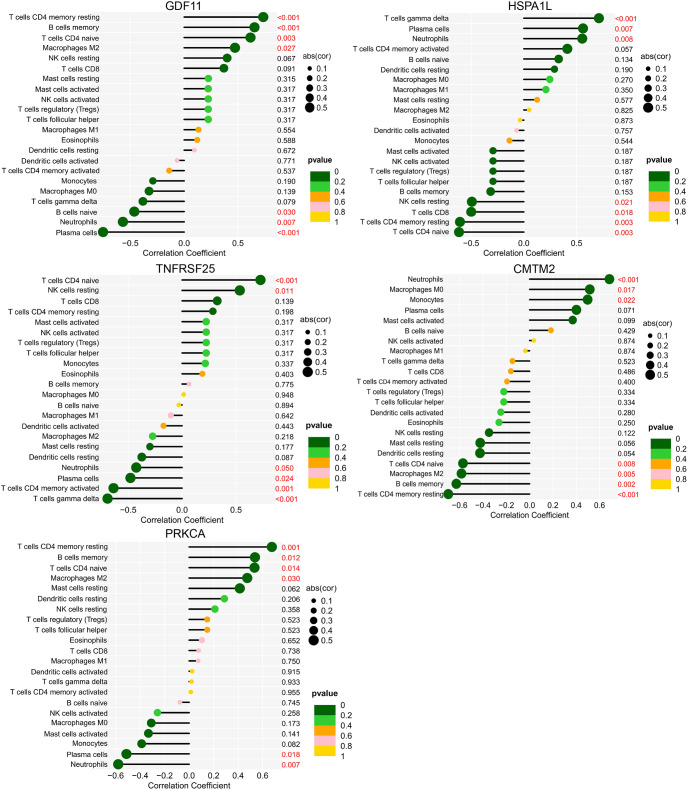
Figure 14.
Correlation between biomarkers and immune cells of the AIS A and AIS D grades of SCI. The ordinate on the left represents the proportion of innate immune cells, the ordinate on the right represents the P value of the correlation test, and the abscissa represents the correlation coefficient. The size of the circle represents the correlation coefficient, and the color of the circle represents the P value of the correlation test; a P value<0.05 was considered statistically significant. SCI, Spinal cord injury; AIS, American Spinal Cord Injury Association Impairment Scale.

