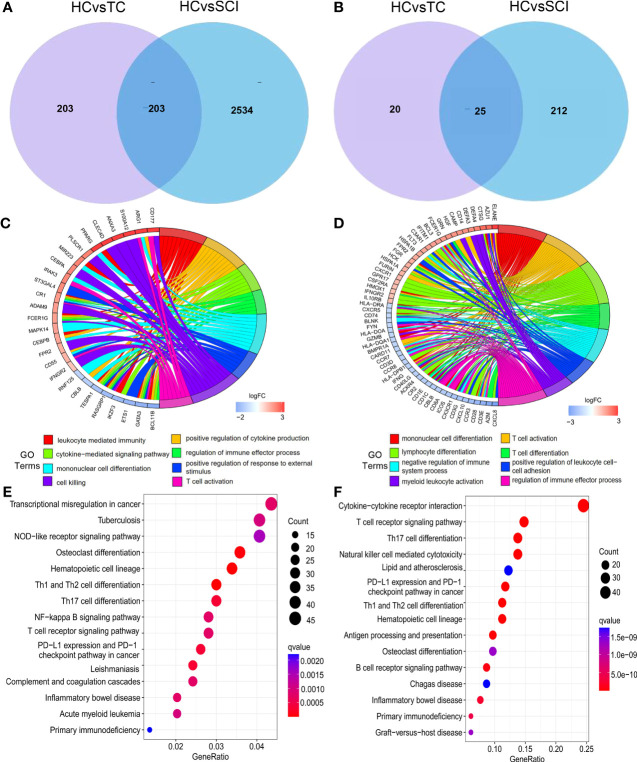
Figure 2.
DEGs and their enrichment analysis. (A) Venn diagram of DEGs between the TC group and HC group and DEGs between the SCI group and HC group. (B) Venn diagram of DEIGs between the TC group and HC group and DEIGs between the SCI group and HC group. (C) GO functional analysis of DEGs between the SCI group and HC group. (D) GO functional analysis of DEIGs between the SCI group and HC group. (E) KEGG enrichment analysis of DEGs between the SCI group and HC group. (F) KEGG enrichment analysis of DEIGs between the SCI group and HC group. SCI, spinal cord injury; HC, healthy uninjured control; TC, trauma controls with noncentral nervous system injury; DEGs, differentially expressed genes; DEIGs, differentially expressed immune-related genes; GO, Gene Ontology; KEGG, Kyoto Encyclopedia of Genes and Genomes.

