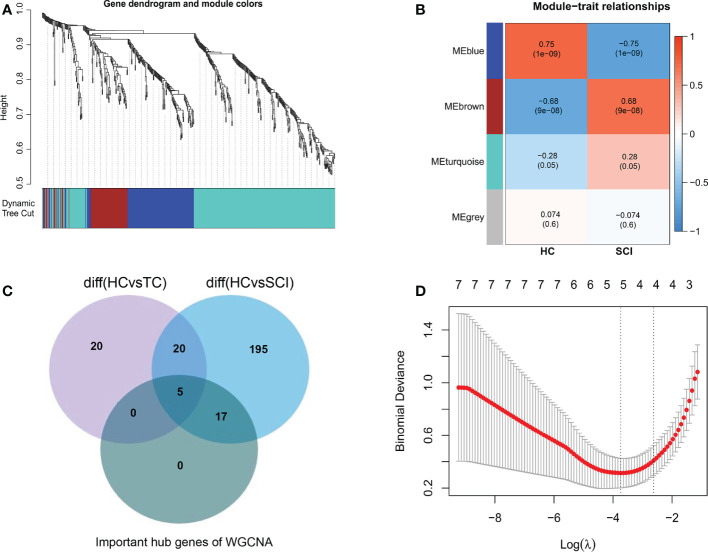
Figure 3.
Identification of characteristic biomarkers of SCI. (A) Dendrogram of immune-related genes in SCI. Each branch of the figure represents one gene, and every color below represents a coexpression module. (B) Heatmap of the correlations between module signature genes and clinical features of SCI. Each row represents a module trait gene, and each column represents a trait. Each cell includes the corresponding correlation and p value. (C) WGCNA hub immune-related genes, DEIGs in SCI, and DEIGs in the TC Venn diagram. (D) LASSO logistic regression analysis. A P value < 0.05 was regarded as statistically significant. SCI, spinal cord injury; HC, healthy uninjured control; TC, trauma control with noncentral nervous system injury; WGCNA, weighted gene coexpression network analysis; AUC, area under the curve; DEIGs, differentially expressed immune-related genes.

