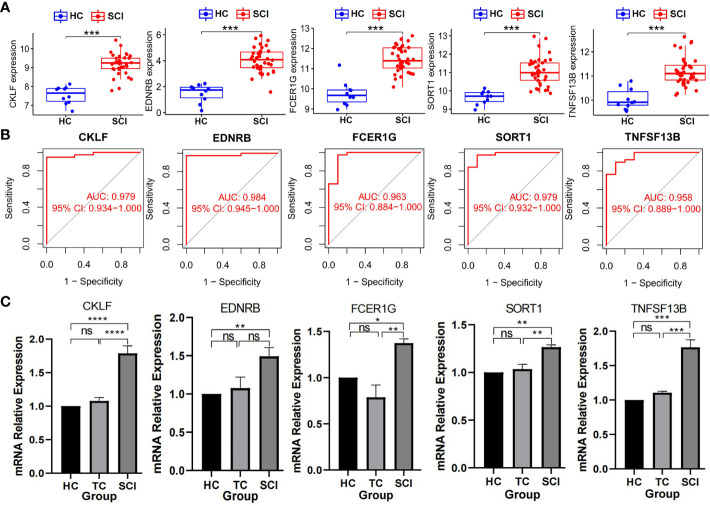
Figure 4.
Detection of biomarkers of SCI. (A) Expression of biomarkers between SCI group and HC group in data set. ***P < 0.005; A P value < 0.5 was regarded as statistically significant. (B) AUC values of the biomarkers. (C) Expression levels of biomarkers detected by qPCR. Values are expressed as the means ± SEM. n = 3 for each group. Student’s t-test was used. ****P < 0.0001; ***P < 0.001; **P < 0.01; *P < 0.05; ns, no significance. A P value < 0.05 was regarded as statistically significant. SCI, spinal cord injury; HC, healthy uninjured control; TC, trauma control with noncentral nervous system injury; AUC, area under the curve; qPCR, quantitative polymerase chain reaction.

