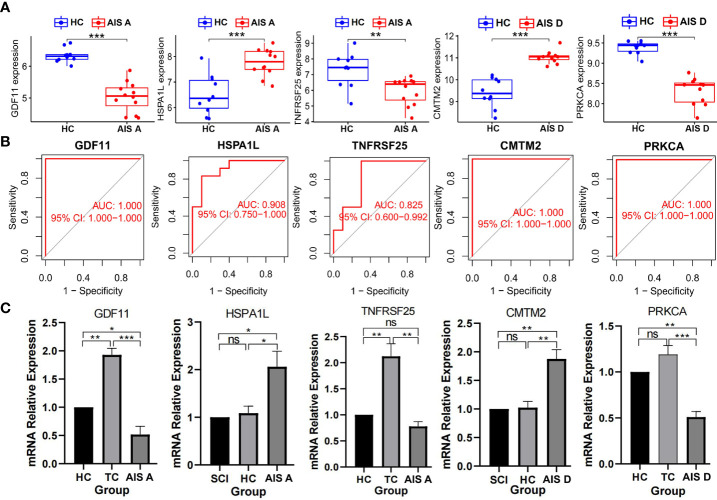
Figure 7.
Detection of biomarkers of the AIS A and AIS D grades of SCI. (A) Expression of biomarkers between different grades of SCI and HC groups in the dataset. (B) Validation of the diagnostic value of biomarkers. (C) Expression levels of biomarkers detected by qPCR. Values are expressed as the means ± SEM. n = 3 for each group. Student’s t-test was used. ***P < 0.001; **P < 0.01; *P < 0.05; ns, no significance. A P value < 0.05 was regarded as statistically significant. SCI, spinal cord injury; HC, healthy uninjured control; TC, trauma control with noncentral nervous system injury; AIS, American Spinal Cord Injury Association Impairment Scale; AUC, area under the curve; qPCR, quantitative polymerase chain reaction.

