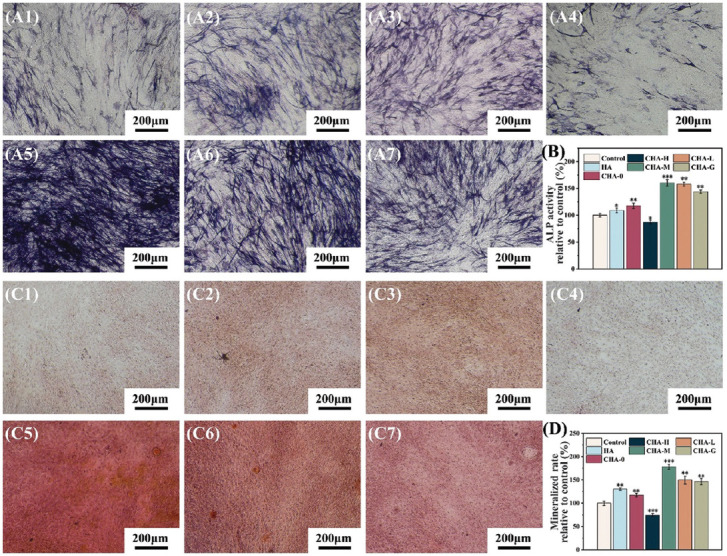
Figure 10.

(A) Alkaline phosphatase (ALP) staining of cells co-cultured with different scaffolds for 14 days, A1 – A7: control, HA, CHA-0, CHA-H, CHA-M, CHA-L, and CHA-G, respectively. (B) Quantitative analysis of ALP activity. (C) ARS staining of cells co-cultured with different scaffolds for 21 days, C1 – C7: control, HA, CHA-0, CHA-H, CHA-M, CHA-L, and CHA-G, respectively. (D) Quantitative analysis of mineralized rate.
