
Figure 7.
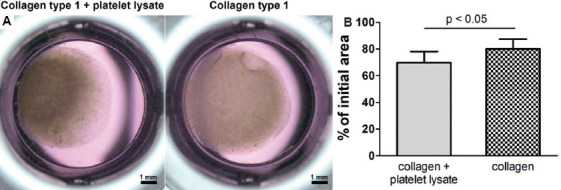
Contraction of collagen + platelet lysate and collagen gels by primary human fibroblasts. (A) Phase-contrast images and (B) reduction of the initial gel area after 48 h. Data represent mean ± SD, n = 8 samples per one data point. The differences between two groups are significant (P < 0.05, Mann–Whitney U-test).