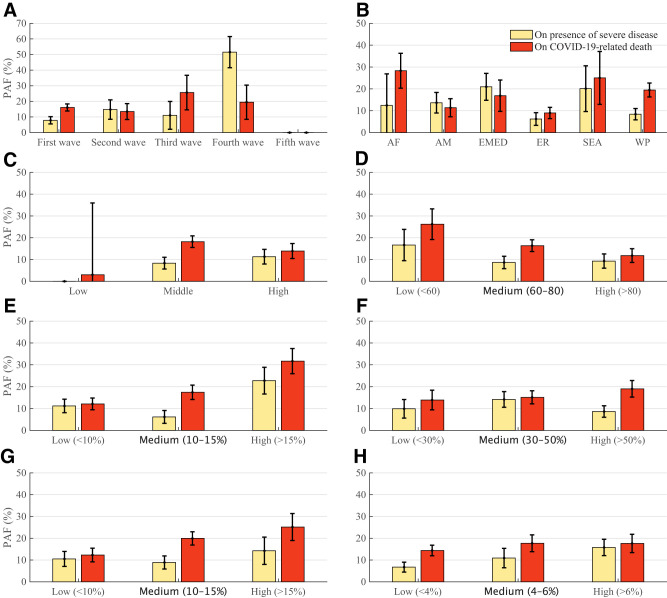
Figure 3.
Estimated PAF of diabetes on presence of severe disease and COVID-19–related deaths by subgroup. PAF shown by COVID-19 waves (A), WHO geographical regions (B), country income level (C), HAQ (D), diabetes background prevalence (E), undiagnosed diabetes proportion (F), IGT (G), and IFG (H). The color bars denote the PAF of diabetes on different worse outcomes of COVID-19 hospitalization. The error bars represent 95% CI. AF, Africa region; AM, Americas region; EMED, Eastern Mediterranean region; ER, Europe region; SEA: Southeast Asia region; WP, Western Pacific region.

