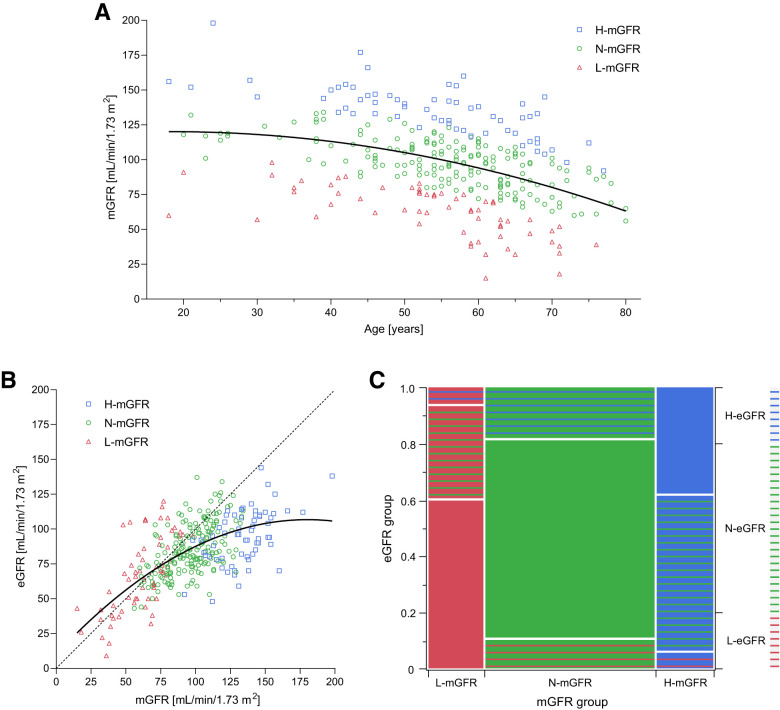
Figure 1.
A and B: Distribution of mGFR by 99mTc-DTPA dynamic renal scintigraphy across ages (A) and its relationship with eGFR by the creatinine-based CKD-EPI equation (B). C: Distribution of participants classified as having H-GFR, N-GFR, or L-GFR according to either mGFR or eGFR. H-GFR, N-GFR, and L-GFR were defined as a GFR value greater than the 80th age- and sex-specific percentile, between the 20th and 80th percentile, or lower than the 20th percentile, respectively. The best fit lines (quadratic) of data are shown as continuous lines, and an ideal linear line of perfect fit is shown as a dashed line. The proportions on the x-axis and the right y-axis of the mosaic plot represent the number of observations for each mGFR and eGFR group, respectively. The proportions on the left y-axis represent the number of observations of each eGFR group within each mGFR group.

