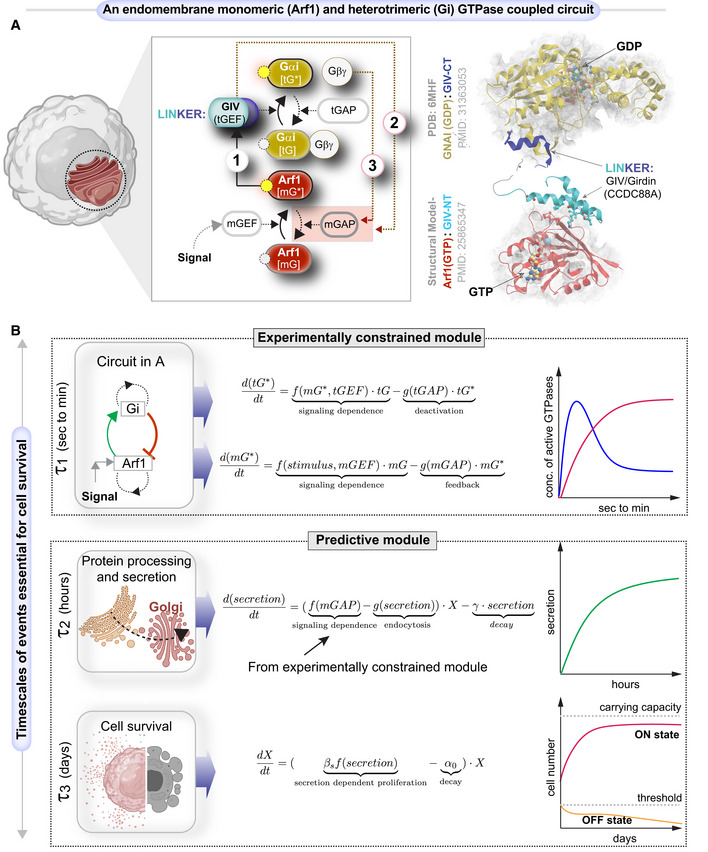
Schematic shows a system of two species of GTPases, mGTPases (mG), and heterotrimeric GTPases (tG), coupled by the linker protein, GIV/Girdin, that is localized on the Golgi membranes within the secretory pathway as the focus of this study. The circuit begins when active Arf1‐GTP directly binds GIV's N‐term HOOK domain, recruits GIV to Golgi membranes, and activates Gi (Lo
et al,
2015; arrow 1). The circuit is completed when GIV's C‐terminus orchestrates two feedback loops (arrows 2 and 3), both of which are essential for the inactivation of Arf1 (Lo
et al,
2015; Kalogriopoulos
et al,
2019). See also Fig
EV1 for illustrations detailing the sequential steps within the dynamic nature of the motif, and Movie
EV1 for the visualization of these dynamic steps as a movie gif.