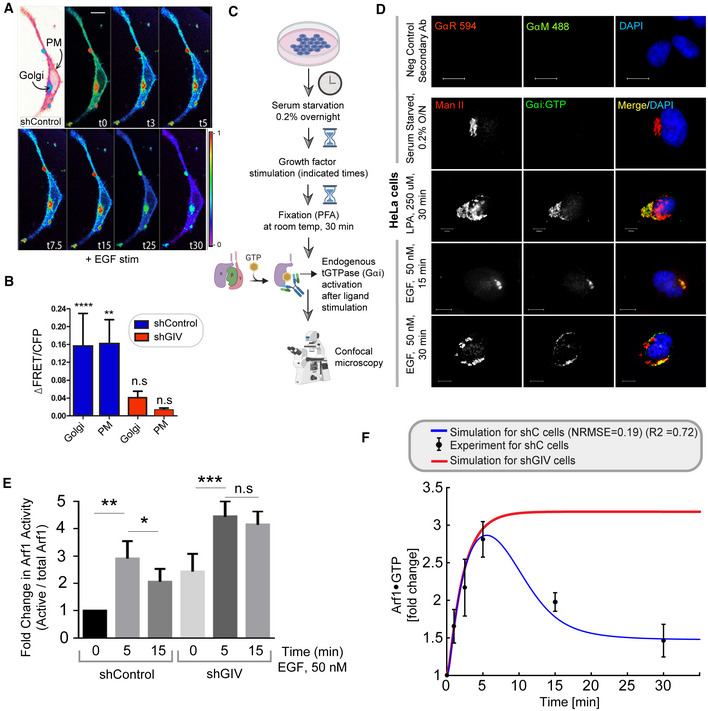
Figure EV2. GEV‐GEM is required for Gi activation at the Golgi and for maintaining the finiteness of Arf1 signaling upon EGF stimulation.

- FRET‐based studies were carried out in sh Control cells as in Fig 3B and C. Briefly, HeLa cells were co‐transfected with Gαi1‐YFP, Gβ1‐CFP and Gγ2 (untagged), and live cells were analyzed by FRET imaging at steady state, after being serum starved in 0.2% FBS overnight and then after stimulation with 50 nM EGF. Representative freeze‐frame FRET images are shown. FRET image panels display intensities of acceptor emission due to efficient energy transfer in each pixel. The FRET scale is shown in the inset. Golgi and PM regions of interest are indicated with arrows. Scale bar = 10 μm.
- Bar graphs display the change in FRET at t5 min at the Golgi and the PM regions of 3–5 cells, from four independent biological replicates. Scale bar = 7.5 μm. Results are displayed as mean ± SEM. Statistical significance was determined by student t‐test and the P‐values are depicted as: **P < 0.01; ****P < 0.0001.
- Schematic showing how a conformation‐specific anti‐Gαi·GTP antibody detects GTP‐bound active Gαi in situ.
- HeLa cells starved with 0.2% FBS overnight or stimulated subsequently with 50 nM EGF or 250 μM LPA were fixed and stained for active Gαi (green; anti‐Gαi:GTP mAb) and Man II (red) and analyzed by confocal microscopy. Activation of Gαi was detected exclusively after LPA/EGF stimulation. When detected, active Gαi colocalizes with Man II (yellow pixels in merge panel). Negative control (secondary antibody) staining was carried out on cells stimulated with EGF, 15 min. Scale bar = 10 μm.
- Control (sh Control) and GIV‐depleted (shGIV) HeLa cells that were stimulated with EGF for the indicated time points prior to lysis were assessed for Arf1 activity. Immunoblots are shown in Fig 3I. Bar graphs display the fold change in Arf1 activity normalized to t0 min that was observed in control (shControl) and GIV‐depleted (shGIV) cells. Results are expressed as mean ± SEM; n = 3 biological replicates; P‐values were determined using Mann–Whitney t‐test compared to t0: *P < 0.05; **P < 0.01; ***P < 0.001. Immunoblots are representative of findings from at least three independent repeats.
- Line graph in red displays a model‐derived simulation of Arf1 activation dynamics (mG*) in cells without tGEF (shGIV). As a reference, the results of model‐derived simulation fit to experimental data in control cells are displayed in blue, and the experimental data for Arf1 activation dynamics are shown as mean ± SEM (n = 3 biological replicates).
