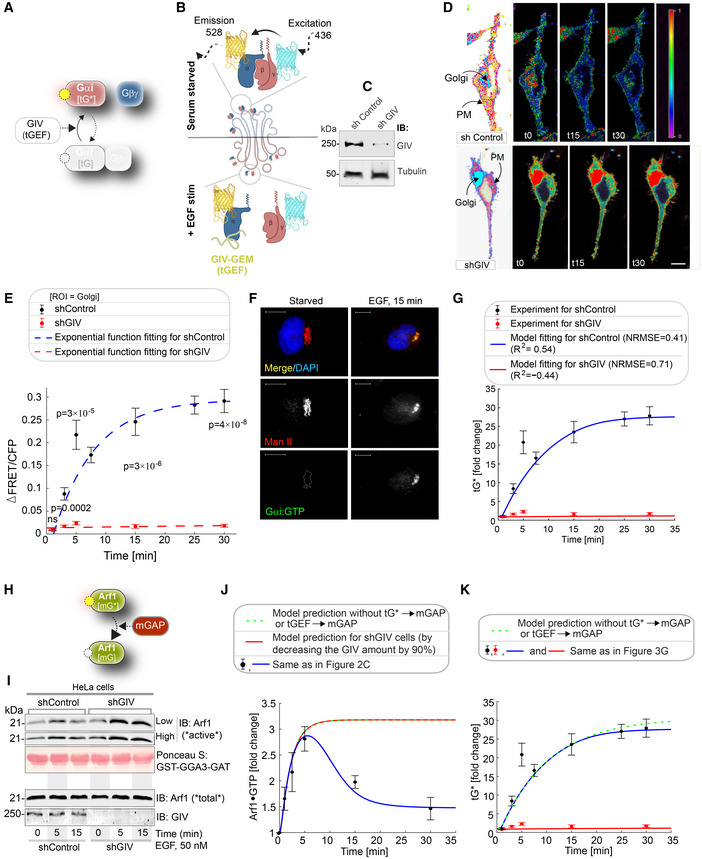
Figure 3. EGF triggers the activation of Gi (tG*) on Golgi membranes, activates ArfGAP, and terminates Arf1 signaling via a feedback loop.

-
ASchematic showing the specific step being interrogated in (B–G), that is, Gi activation.
-
BSchematic describing the mechanism of the FRET Gαi activity reporter. Serum‐starved conditions are expected to have more inactive trimeric Gi, and hence show high FRET (top). Upon ligand stimulation, GIV‐dependent dissociation of trimers is expected, with a resultant loss of intermolecular FRET.
-
CEqual aliquots (~45 μg) of whole cell lysates of control (shControl; top) and GIV‐GEM depleted (shGIV; bottom) HeLa cells were analyzed for GIV and tubulin (loading control) by immunoblotting (IB).
-
DControl (sh Control; top) and GIV‐GEM depleted (shGIV; bottom) HeLa cells were co‐transfected with Gαi1‐YFP, Gβ1‐CFP and Gγ2 (untagged), and live cells were analyzed by FRET imaging at steady state, after being serum starved in 0.2% FBS overnight and then after stimulation with 50 nM EGF. Representative freeze‐frame FRET images are shown. FRET image panels display intensities of acceptor emission due to efficient energy transfer in each pixel. The FRET scale is shown in the inset. Golgi and PM regions of interest are indicated with arrows. Scale bar = 10 μm. See also Fig EV2A and B for free‐frame images for additional time points in control HeLa cells.
-
EΔFRET/CFP at the Golgi (derived from D) as a function of time. The data are represented as mean ± SEM. Interrupted lines display the fitting results using exponential functions for shControl (blue) and shGIV cells (red). Data represent five regions of interest (ROIs) analyzed over the pixels corresponding to the Golgi of 3–5 cells from two independent biological experiments, that is, n = 8 biological replicates. P‐values, as determined against t0 using Mann–Whitney are displayed.
-
FHeLa cells starved with 0.2% FBS overnight or stimulated subsequently with 50 nM EGF were fixed and stained for active Gαi (green; anti‐Gαi:GTP mAb) and Man II (red) and analyzed by confocal microscopy. Activation of Gαi was detected exclusively after EGF stimulation. When detected, active Gαi colocalizes with Man II (yellow pixels in merge panel). See also Fig EV2C and D for additional time points and stimulus. Scale bar = 7.5 μm.
-
GModel fit for the fold change of active tGTPase (denoted as tG*). Experiment data are the fold change of ΔFRET/CFP in (D) and is shown as mean ± SEM (n = 8; 3–5 cells from two independent biological experiments). Continuous lines display the model simulation results after parameter fitting (See Table EV1 for parameters).
-
HSchematic shows the step being interrogated in (I–K), that is, the termination of Arf1 signaling.
-
IImmunoblot shows bound Arf1 (active; top) and total Arf1 (input lysates; bottom) from equal aliquots of lysates of control (sh Control) and GIV‐depleted (shGIV) HeLa cells. Cells were stimulated with EGF for the indicated time points prior to lysis. Bar graphs in Fig EV2E display the fold change in Arf1 activity normalized to t0 min. “Low” and “high” indicate exposures.
-
J, KModel predictions of Arf1 activation dynamics (J) and Gαi activation dynamics (K) when negative feedback do not exist. The depletion of negative feedback in the model is achieved by deleting either or (interrupted green line). These two depletion ways have no difference due to AND gate logic; please see also Fig EV3 for model predictions using OR logic. The red line in (J) was obtained by setting the GIV amount to 10% of the control cell, matching the low concentration of GIV in shGIV cells. As a reference, the experimental data (i.e., error bars in black and red) and model fit results (curves in blue and red) in Figs 2C and 3G are also displayed here, which were plotted in a same way as in Figs 2C and 3G.
Source data are available online for this figure.
