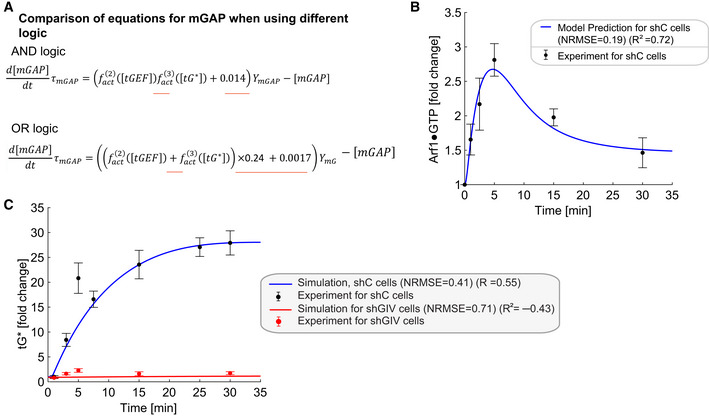
Figure EV3. Simulations of Arf1 activation dynamics (mG*) and Gi activation dynamics (tG*) when using OR logic.

-
AComparisons of equations for mGAP when using different logics. The AND and OR logic are modeled by and , respectively. The constants 0.24 and 0.0017 ensure that the steady‐state values of all species when using OR logic are the same as those for AND logic. The differences between the two models are underlined in red in the equations.
-
B, CSimulations of Arf1 (B) and Gi (C) activation dynamics for OR logic. The OR logic also captures the experimental data reasonably well but the AND logic is better informed experimentally. The experimental data are the same as those in Fig 3J and K.
