
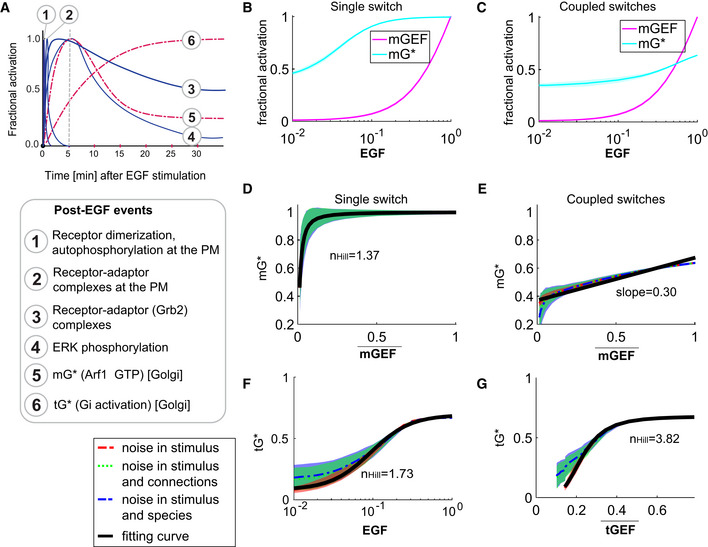
Figure EV4. Coupled switches enable the alignment of endomembrane responses (Arf1 and tG* activities) to the dose of an extracellular stimulus.
-
APublished dynamics of EGF‐stimulated events that are initiated at the PM (blue, continuous) or experimentally determined dynamics of events at the Golgi confirmed here (red, interrupted) are compared. The interrupted line at 5 min provides a reference frame for the observed peak Arf1 activity upon EGF stimulation.
-
B, CDose responses of fractional activations of mGEF and active Arf1 (mG*) for the single switch (B; mG alone) and coupled switches (C; mG and tG). We perform stochastic simulations in the presence of noise in EGF (see Materials and Methods for details). The mean and the standard deviation (SD) of species are evaluated at steady states. The dimensionless EGF concentrations in the simulations are obtained through normalization, that is, dividing the EGF concentration by 217.4 nM (=50 nM/0.23). In all simulations, noise is introduced only in stimulus (i.e., EGF).
-
D, EThe same plots as in Fig 4A and B but in the presence of three different types of noise: noise in stimulus (shown in red), noise in stimulus and connections simultaneously (shown in green), and noise in stimulus and species simultaneously (shown in blue; see Materials and Methods for details). Data are shown as mean values (dashed curves), with the shading showing the SD. The black curves are fitting curves (r 2 > 0.95) for red dashed curves (see Materials and Methods for the calculations of r 2 and ).
-
F, GThe fractional activations of tGTPase (tG*) as a function of EGF (F) or tGEF (G). The plots are generated in a similar way as in (F, G). denotes the mean of tGEF. r 2 > 0.95 for all fitting curves. The EGF‐tG* relationship shows a Hill coefficient of 1.73, and the tGEF→tG* switch (switch #2) shows a dose–response behavior close to the saturation regime of an ultrasensitive curve (n Hill = 3.82).