
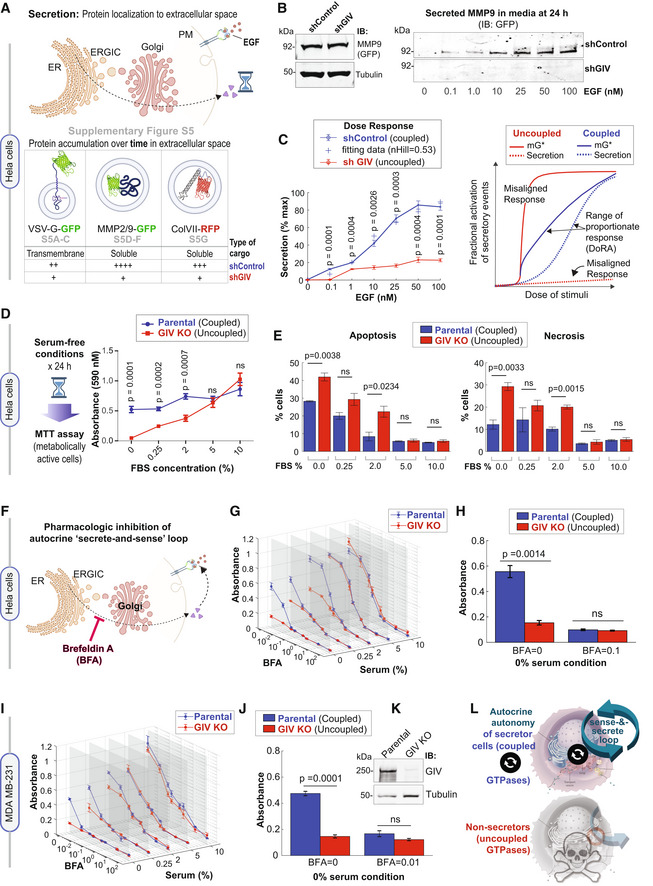
Figure 6. Coupling of GTPases by GIV is required for growth factor‐independent cell survival that relies upon autocrine secretion.
-
ASchematic summarizes the findings showcased in Fig EV5, which investigate the secretion of diverse cargo proteins [temperature‐sensitive (ts) VSV‐G, MMP2/9, and ColVII], as determined by their accumulation in extracellular space over time after the stimulus (EGF or serum). For each cargo tested, compared to cells with GIV (shControl), ligand‐stimulated secretion was impaired in cells without GIV (shGIV).
-
BImmunoblots showing intracellular (left) and secreted (in the media; right) GFP‐MMP9 at 24 h after stimulation with varying doses of EGF. Tubulin, used as a loading control, confirms the presence of a similar number of plated cells in the assay.
-
CLeft: Graph displays experimentally determined secretion of GFP‐MMP9 in response to varying doses of EGF in control (shControl) and GIV‐depleted (shGIV) HeLa cells (as in B), and quantified by band densitometry. Results are expressed as mean ± SEM; n = 3 biological replicates. P‐values were determined by a two‐sided unpaired t‐test. Right: Schematic diagram of dose responses (mG* and secretion) for the single switch and coupled switches. Coupled switches stretch the range of proportionate responses. Single mG switch results in misaligned responses. DoRA, dose–response alignment.
-
DLeft: Schematic summarizing the colorimetric assay used here to determine the number of metabolically viable cells. Right: The graph displays formazan absorbance expressed as a measure of cell viability from the HeLa cells (Y‐axis) cultured at varying conc. of serum (X‐axis). Results are expressed as mean ± SEM; n = 3 biological replicates. P‐values were determined by a two‐sided unpaired t‐test.
-
EBar graphs display the % apoptotic (left) or necrotic (right) control (parental) and GIV‐depleted (GIV KO) HeLa cells after 24 h growth in varying concentrations of serum, as assessed by annexin V staining and flow cytometry. See also Appendix Fig S5 A–C for dot plots and early and late apoptotic fractions. Results are expressed as mean ± SEM; n = 3 biological replicates. P‐values were determined by a two‐sided unpaired t‐test.
-
FSchematic showing the rationale for and mechanism of action of fungal toxin, BFA, for interrupting the secrete‐and‐sense autocrine loop in cells.
-
G, H
Control (parental) and GIV‐depleted (GIV KO) HeLa cells grown in different concentrations of serum (FBS%) were treated or not with varying concentrations of BFA (μM) as indicated. Line graphs in 3D (G) depict the formazan absorbance expressed as a measure of cell viability from the HeLa cells in various conditions tested. Bar graphs (H) depict the cell number in serum‐free growth conditions that are supported exclusively by the autocrine secrete‐and‐sense loop (without BFA; BFA = 0.0 μM) or when such loop is interrupted (BFA = 0.1 μM). Results are expressed as mean ± SEM; n = 3 biological replicates. Statistical significance was determined by one‐way ANOVA.
-
I–K
Control (parental) and GIV‐depleted (GIV KO) MDA MB‐231 cells grown in different concentrations of serum (FBS%) were treated or not with varying concentrations of BFA (μM) as in (G, H). Line graphs in 3D (I) depict the formazan absorbance expressed as a measure of cell viability from the MDA MB‐231 cells in various conditions tested. Bar graphs (J) depict the viability of the MDA MB‐231 cells in serum‐free growth conditions that are supported exclusively by the autocrine secrete‐and‐sense loop (without BFA; BFA = 0.0 μM) or when such loop is interrupted (BFA = 0.1 μM). Results are expressed as mean ± SEM; n = 3 biological replicates. Statistical significance was determined by one‐way ANOVA. Immunoblots (K) of equal aliquots of whole cell lysates confirm the depletion of GIV compared to tubulin (loading control). See also Appendix Fig S5 D–H for dot plots and early and late apoptotic fractions. Results are expressed as mean ± SEM; n = 3 biological replicates.
-
LSummary of conclusions of this work. Top: Coupling of GTPases within the secretory pathway enables dose–response alignment of secretion to stimulus, which appears to be essential for “secrete‐and‐sense” autocrine autonomy in cancer cells. Bottom: Uncoupling of the GTPases within the secretory pathway disrupts such autonomy and leads to cell death.
Source data are available online for this figure.