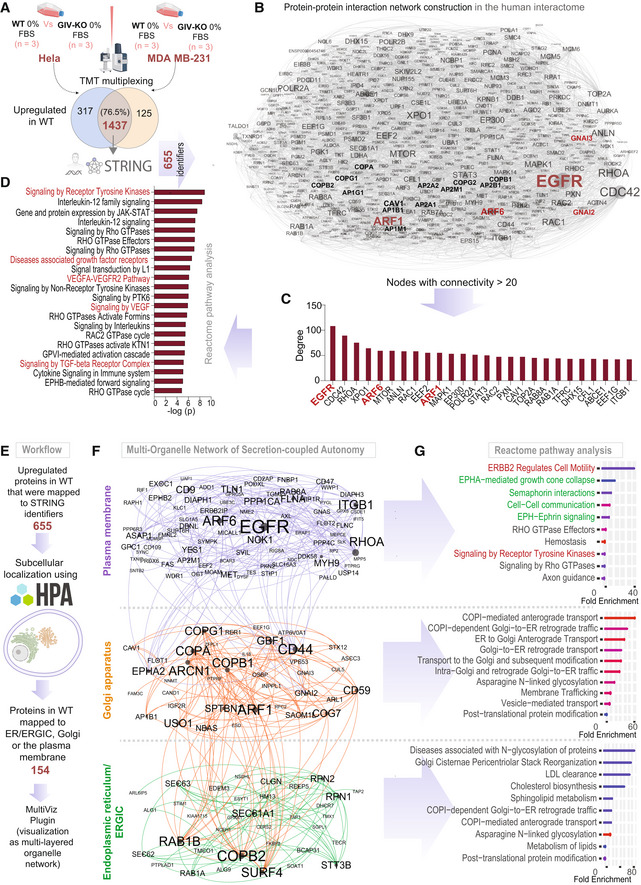
Figure 7. Differential proteomics of autonomy enabled vs. disabled MDA MB‐231 and HeLa cells.

- Workflow for comparative proteomics on autonomy enabled vs. disabled cells by tandem mass tag (TMT) multiplex technique followed by mapping of upregulated proteins in WT cells using the STRING database (see Materials and Methods).
- A protein–protein interaction (PPI) network shows the interactions between upregulated mapped proteins in WT cells. Node and font sizes correlate positively with the degrees of connectivity.
- Bar plot shows the degree distribution of highly connected (degree > 20) nodes in the PPI network in (B).
- Reactome pathway analysis of the pathways enriched in the most connected proteins in (C). Red = pathways associated with growth factor signaling.
- Workflow for the construction of a multi‐organelle network of autonomy‐enabled cells using subcellular localization of upregulated proteins in the WT cells.
- Visualization of a multi‐organelle network of proteins that partake in secretion‐coupled autonomy across three compartments, the plasma membrane, the Golgi, and the ER/ERGIC.
- Reactome pathway analyses of the pathways enriched within the three organelles in (F). Red pathways associated with RTK/EGFR signaling and Green pathways associated with multi‐cellular cell–cell communication in the plasma membrane.
