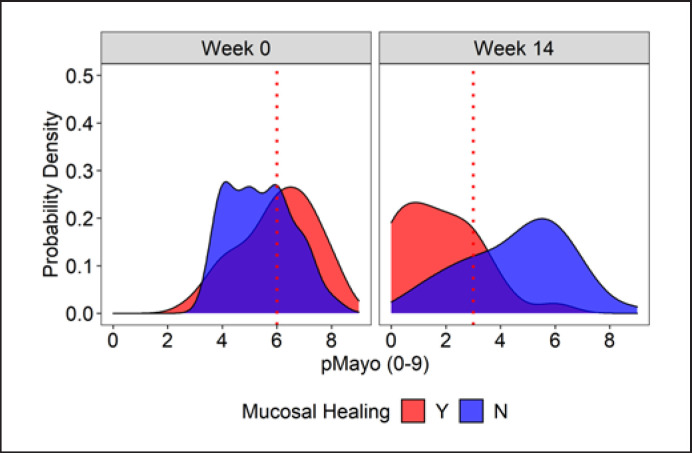
Fig. 2.
Comparison of probability density. The distribution of MHs (red) and non-MHs (blue) at week 0 and week 14 is shown. The vertical axis denotes the probability density, while the horizontal axis denotes the pMayo score. The red dotted line denotes the cutoff value of MHs at a crossed point between the red and blue zones. pMayo, partial Mayo score.

