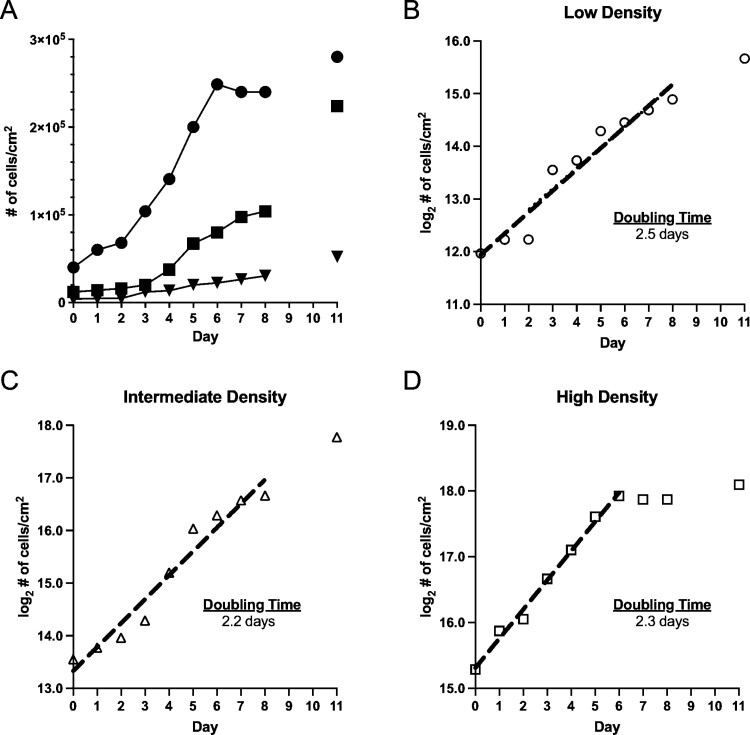
Fig. 2.
Growth kinetics of CxTr cells seeded at different initial densities. (A) Cell growth reported as cell density cells/cm2 for: Filled inverted triangles represent low initial density—4,000 cells/cm2 data points. Filled squares represent intermediate initial density—12,000 cells/cm2 data points. Filled circles represent high initial density—40,000 cells/cm2 data points. Log2 transformations of cell count data from seeding densities over the 8-day period. Dashed lines were fitted by simple linear regression and indicate exponential growth. Doubling times are indicated in the graphs. (B) Low density, (C) Intermediate density, (D) High density. The line fitted excludes the points after Day 5, when growth began to decline. Analysis and graphs were made with GraphPad Prism 9.0. See Supp Data S2 (online only) for details of the linear regressions.

