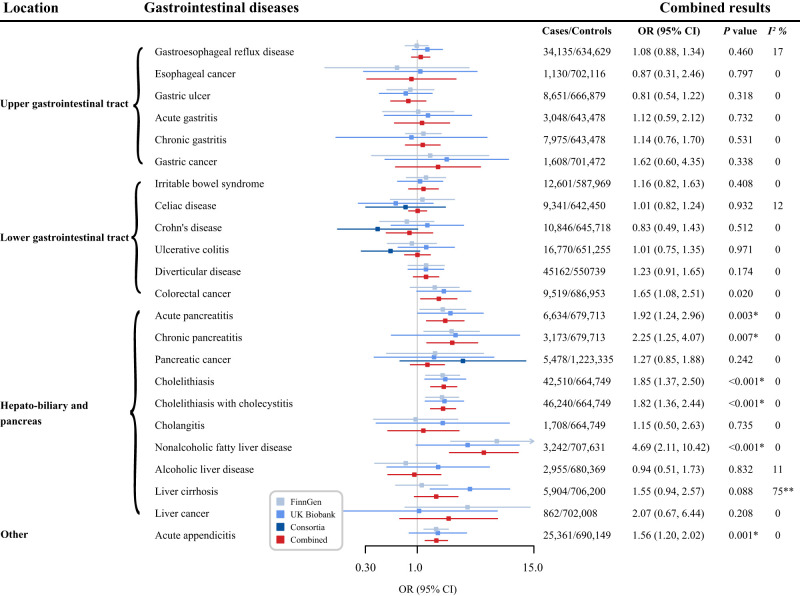
Figure 3.
Associations of genetically predicted fasting insulin levels with gastrointestinal diseases. The ORs were scaled to a 1-unit increase in log-transformed pmol/L. P values are for ORs (95% CIs). *P < 0.05 after multiple testing correction; **P < 0.05 for heterogeneity test. I2 values <25%, 25–75%, and >75% were considered to indicate low, moderate, and high heterogeneity, respectively.

