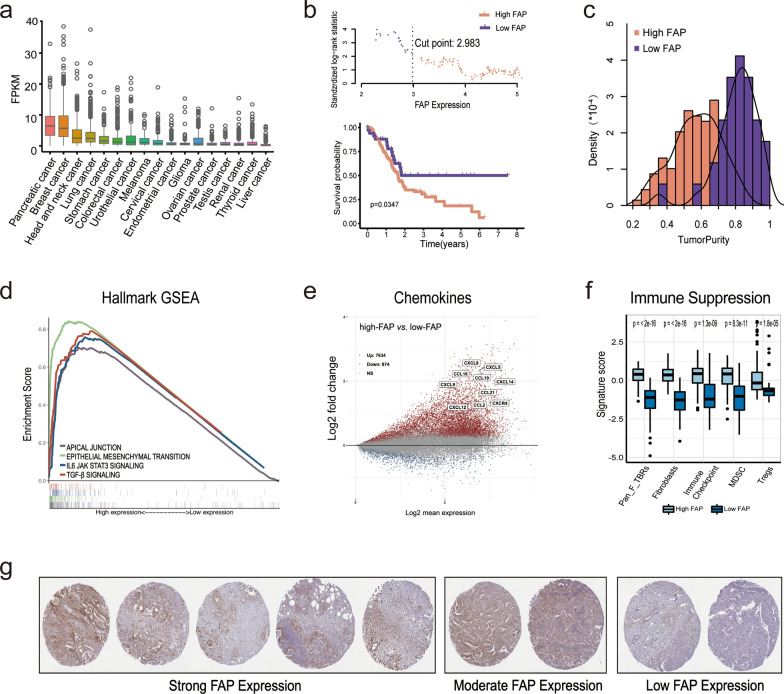
Fig. 1.
Bioinformatics analysis of FAP biological and tumor microenvironment characteristics in pancreatic cancer. a Pan-cancer analysis of FAP expression. b Identification of optimal FAP expression cutoff dividing PDAC cohort. The upper scatter plot shows each cutoff point’s standardized log-rank statistic value. The lower Kaplan-Meier plot shows overall survival for patients divided by the optimal cutoff. c–f Biology and TME characteristics in high-FAP vs. low-FAP groups of PDAC cohort. c Density distribution of tumor purity. d Enrichment score of HALLMARK gene-sets related to high FAP expression. e Volcano map of the chemokines. f Immune suppressive characteristics estimated by IOBR. g IHC staining of FAP protein expression in 9 pancreatic cancer samples

